

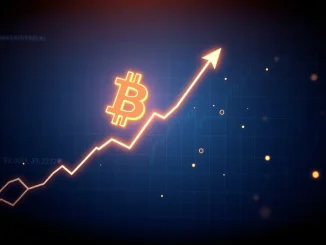
A massive cluster of bearish bets in Bitcoin derivatives markets is creating a precarious situation. Data from April 2026 shows that if Bitcoin’s price climbs to $72,000, it could trigger over $2.5 billion in forced liquidations of short positions. This sets the stage for a potential short squeeze that would punish traders betting against the cryptocurrency.
The $2.5 Billion Bitcoin Short Liquidation Zone
According to estimates from analytics firm Coinglass, a price move to $72,000 represents a key danger level for bearish traders. From a recent price near $67,100, that’s an increase of just 7.5%. Yet that modest rally would be enough to wipe out a significant portion of the market’s leveraged short positions. This data highlights the high-stakes nature of current futures trading.
Liquidations occur when an exchange automatically closes a leveraged position because the trader has lost their initial collateral, or margin. A cascade of such forced buys to cover shorts can fuel a rapid price increase—a phenomenon known as a short squeeze. The scale of this risk suggests many traders are positioned for further downside. Industry watchers note that such crowded trades often reverse violently.
Forces Pressuring Bitcoin’s Price
Several factors have contributed to the buildup of bearish sentiment and the stall in Bitcoin’s price ascent since mid-March 2026. The primary headwind has been geopolitical tension. Conflict involving Iran, which escalated in late February, pushed oil prices to multi-year highs. This creates broader economic uncertainty and can pressure risk assets like cryptocurrencies.
Also read: Spain’s CNMV Chair Rules Out MiCA Deadline Extension for Crypto Firms, Impacting Binance
Additional selling pressure came from an unexpected source: Bitcoin miners. On March 26, 2026, publicly traded miner MARA Holdings announced it sold 15,133 BTC. The company stated it was reducing its Bitcoin holdings to pay down debt and shift some focus to other computing ventures. Large, identifiable sales from long-term holders can dampen market sentiment.
Traditional markets have also offered little support. The S&P 500 index fell roughly 10% from its late January peak through late March. This decline reflects investor concerns about persistent inflation limiting central banks’ ability to cut interest rates. When traditional risk assets struggle, capital often flows away from crypto markets as well.
Shifting Interest Rate Expectations
Market expectations for U.S. Federal Reserve policy have hardened significantly. Data from the CME FedWatch Tool in early April 2026 shows traders assign an 89% probability that the Fed will hold interest rates steady through its September meeting. This is a stark reversal from early March, when futures markets priced in a 79% chance of rate cuts. Higher-for-longer rates make yield-bearing assets more attractive relative to speculative ones like Bitcoin.
Bearish Confidence and Market Signals
One clear metric shows the growing confidence of bears: the funding rate for Bitcoin perpetual futures contracts. This rate is a fee paid between long and short position holders to keep the contract price aligned with the spot market. Typically, longs pay shorts a small fee. In recent weeks, this rate has turned negative.
A negative funding rate means short sellers are paying longs to maintain their positions. This is unusual and signals a strong consensus for lower prices. Data from platform Laevitas confirms this bearish tilt. However, extreme positioning often precedes a reversal. When too many traders lean one way, even a modest shift in news flow can trigger a rapid unwind.
Potential Catalysts for a Bitcoin Reversal
Despite the bearish backdrop, analysts point to two specific events that could rapidly shift momentum and push Bitcoin toward the critical $72,000 liquidation level.
Geopolitical De-escalation: Any move toward a ceasefire in the ongoing conflict would likely boost global risk sentiment. Oil prices would likely retreat, easing inflation fears. This could trigger a broad rally in assets like stocks and crypto. Such a move would catch overconfident short sellers off guard.
Resumption of ETF Inflows: The direct link between U.S. spot Bitcoin ETF flows and price is now well-established. In mid-March, Bitcoin surged from $69,150 to $74,900 over five days. This rally coincided with two weeks of substantial net inflows into these funds, totaling $1.5 billion. If institutional demand via ETFs returns, it could provide the sustained buying pressure needed to challenge the $72,000 level.
Market structure suggests a move of this magnitude is plausible. Bitcoin has traded in a range for weeks, allowing utilize to build on both sides. A breakout could be powerful.
Broader Economic and Political Factors
U.S. fiscal policy adds another layer of complexity. In early April 2026, the White House released a budget proposal for 2027 that requested a significant increase in defense spending. To offset this, the proposal outlined cuts to other domestic areas. Such proposals can influence long-term economic forecasts and market volatility.
Furthermore, if signs of economic weakness emerge, investors historically seek alternative stores of value. With Bitcoin trading nearly 50% below its all-time high in early April 2026, some analysts argue it presents a hedge against traditional market stress. This dynamic could support prices independently of geopolitical news.
Conclusion
The derivatives market is flashing a clear warning for Bitcoin bears. A relatively small rally to $72,000 threatens $2.5 billion in short positions with liquidation. Current bearish sentiment, driven by war, miner sales, and weak stocks, has created a crowded trade. The implication is that the market is vulnerable to a sharp reversal. Catalysts like a geopolitical ceasefire or renewed ETF buying could be the match. For traders, this means extreme caution is warranted on both sides of the market. The setup for a volatile and decisive move in Bitcoin is firmly in place.
FAQs
Q1: What does a $2.5 billion Bitcoin short liquidation mean?
It means that if Bitcoin’s price rises to $72,000, traders who have borrowed and sold Bitcoin (shorted it) using employ will have their positions automatically closed by exchanges. This could force them to buy Bitcoin to cover their shorts, potentially pushing the price even higher in a feedback loop.
Q2: Why are traders so bearish on Bitcoin recently?
Several factors have aligned: geopolitical conflict has raised oil prices and economic uncertainty, a major Bitcoin miner sold a large portion of its holdings, and traditional stock markets have declined. This has led many to bet on further Bitcoin price drops.
Q3: What is a negative funding rate in Bitcoin futures?
In perpetual futures contracts, a negative funding rate indicates that traders with short positions are paying a fee to traders with long positions. This is unusual and typically signals that the market is overly bearish, with more people betting on price declines than rises.
Q4: How could Bitcoin ETF flows push the price to $72,000?
U.S. spot Bitcoin ETFs buy actual Bitcoin to back their shares. Sustained net inflows mean consistent buying pressure in the spot market. Historical data, like the $1.5 billion inflow in mid-March 2026 that pushed Bitcoin up 8%, shows a direct correlation between ETF buying and price increases.
Q5: What is a short squeeze?
A short squeeze happens when the price of an asset rises, forcing traders who bet against it (shorted it) to buy it back to limit their losses. This wave of buying can drive the price up even further, creating a rapid and often painful rally for those on the wrong side of the trade.


Be the first to comment