

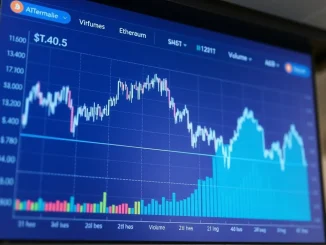
Bitcoin bulls are mounting a fresh challenge against a major price barrier. As of April 11, 2026, the leading cryptocurrency is testing overhead resistance near $76,000. A successful breakout could reignite the broader digital asset market. This analysis examines the technical setup for Bitcoin and nine major altcoins, based on chart patterns and on-chain data.
Bitcoin’s Major Moment at $76,000
Bitcoin’s price action has entered a decisive phase. After a week of upward pressure, BTC faces significant selling near the $76,000 level. Data from Farside Investors shows US spot Bitcoin ETFs had a mixed week, but finished with net inflows of $576.5 million. This suggests institutional interest persists despite volatility.
Also read: Botanix shutdown: Does Bitcoin DeFi have a demand problem?
The 20-day exponential moving average has turned upward, sitting near $69,587. Meanwhile, the Relative Strength Index (RSI) has moved into positive territory. These are typically considered bullish technical signals. But the real battle is just ahead.
According to blockchain analytics firm Glassnode, Bitcoin must clear two major hurdles for a sustainable recovery. The first is the True Market Mean at $78,000. The second is the Short-Term Holder Cost Basis at $81,600. Until these levels are conquered, Glassnode’s analysis suggests the “mid to long-term bias remains tilted to the downside.” The firm notes that any rally into this zone may face selling from recent buyers looking to exit at breakeven.
Also read: Bitcoin Options Traders Hedge Downside as Uncertainty Lingers, Anchorage Digital Reports
A daily close above $76,000 would complete a bullish ascending triangle pattern. This could open a path toward $84,000. Conversely, a rejection here that pushes price below the pattern’s support line risks a decline toward the $62,500 to $60,000 support zone. The next few trading sessions are critical.
Ethereum Shows Signs of Bottoming Formation
Ether appears to be forming a potential market bottom alongside Bitcoin. The Capriole Macro Index Oscillator recently recorded a reading of -2.42, signaling undervaluation. This is a notable data point. In 2022, ETH found a bottom between $1,000 and $1,200 when this same indicator fell to -2.2.
This comparison suggests limited downside risk from current levels near $2,200. It also implies greater upside potential if market sentiment improves. The immediate challenge for bulls is to push ETH above the $2,274 level. A break above this could lead to a test of the $2,400 resistance. Success there might fuel a move toward $2,800.
The bearish scenario involves a turn downward that breaks below the moving averages. That would indicate sellers are active at higher prices. Such a move could see ETH retreat to its solid support level at $1,916. The $2,200 level is currently acting as a battleground between buyers and sellers.
Altcoin Analysis: Mixed Signals Across Major Tokens
Major altcoins are presenting a varied technical picture. Their near-term trajectories largely depend on Bitcoin’s ability to sustain momentum.
XRP and BNB Face Selling Pressure
XRP buyers have repeatedly failed to push the price above its 50-day simple moving average near $1.38. This indicates aggressive defense by sellers. Both moving averages are flattening, and the RSI sits just below the midpoint. This points to a slight edge for bears.
A break below $1.27 could resume a downtrend toward $1.11. The larger support line of a descending channel pattern sits near $0.90. On the flip side, a decisive move above the 50-day SMA would shift short-term advantage to buyers, potentially leading to a rally toward the pattern’s downtrend line.
BNB shows similar struggles. It has failed to rise above its 50-day SMA near $626. Sellers are defending this level on minor rallies. A drop below $570 could resume a downtrend toward the next major support at $500. A close above the moving averages would signal an extended period of range-bound trading. Bulls need a close above $687 to regain clear control.
Solana and Dogecoin in Consolidation Patterns
Solana has been trading between $76 and $98. This range-bound action indicates balanced buying on dips and selling on rallies. The next significant move will likely begin with a break above $98 or below $76. A bullish breakout could target $117. A bearish breakdown might see a drop to $67.
Dogecoin’s chart shows a different pattern. It has failed to rise above a clear downtrend line, suggesting continued bearish pressure. Sellers aim to pull DOGE below the $0.09 support to complete a bearish descending triangle. If successful, the meme coin could plunge to $0.08, and later toward a pattern target near $0.06. However, a break above the downtrend line would be a positive sign, potentially attracting buyers for a climb toward $0.11.
Cardano, Bitcoin Cash, and Chainlink Await Directional Cues
Cardano sellers are defending the 50-day SMA near $0.26. Bulls have so far prevented a drop back below $0.25. A close above the 50-day SMA could open a path toward ADA’s downtrend line. A break above that line would signal a potential short-term trend change. The key support to watch is $0.23. A drop below that could lead to a decline toward $0.22 and potentially $0.16.
Bitcoin Cash is testing resistance at its 20-day EMA near $451. The fact that bulls have not ceded much ground increases the chance of a break higher. If successful, BCH could climb to its 50-day SMA near $465, and then to the $486 resistance. A close above $486 would suggest the market rejected the recent break below the $443 support. Sellers will try to defend the moving averages and pull price below $420, which could trigger a drop to $375.
Chainlink has been stuck between $8 and $10. This extended consolidation shows a balance between supply and demand. Typically, the longer a price remains in a tight range, the stronger the eventual breakout. The flattish moving averages and RSI near the midpoint offer no clear advantage to either side. A break above $10 could start a new uptrend toward $11.61. A close below $8 might resume the downtrend toward the $6 level.
Market Context and On-Chain Perspective
The current market setup reflects a broader tension. Spot ETF flows provide a foundation of demand, but overhead resistance and on-chain selling pressure create headwinds. Glassnode’s analysis highlights the importance of the $78,000 to $81,600 zone as a supply overhang from recent buyers.
This creates a high-stakes environment. A clean breakout above $76,000 could trigger algorithmic buying and renewed bullish sentiment. A rejection could reinforce the narrative of a extended consolidation phase. For altcoins, Bitcoin’s direction remains the primary catalyst. Most are positioned at key technical levels, ready to move in sympathy with the market leader.
Conclusion
The Bitcoin price prediction for April 2026 hinges on the outcome at the $76,000 resistance level. A successful breakout would likely propel BTC toward $84,000 and energize the altcoin market. Failure here risks a pullback toward the $60,000 support zone. Ethereum shows undervaluation signals, while major altcoins like XRP, SOL, and ADA await a decisive cue from Bitcoin. Traders should watch for a confirmed daily close above or below these key levels for the next major directional move.
FAQs
Q1: What is the key resistance level for Bitcoin in April 2026?
The key overhead resistance level for Bitcoin is $76,000. A daily close above this price would complete a bullish chart pattern and could open a path toward $84,000.
Q2: What does Glassnode say Bitcoin needs for a sustainable recovery?
According to Glassnode’s on-chain analysis, Bitcoin needs to cross the True Market Mean at $78,000 and the Short-Term Holder Cost Basis at $81,600 to transition into what the firm calls a “sustainable recovery regime.”
Q3: Which altcoin is showing signs of being undervalued?
Ethereum is showing potential undervaluation signals. The Capriole Macro Index Oscillator recorded a reading of -2.42, which is similar to levels seen at its 2022 market bottom.
Q4: What is the trading range for Solana?
Solana has been consolidating inside a range between $76 and $98. A break above $98 could target $117, while a break below $76 might lead to a test of $67.
Q5: How did Bitcoin ETF flows perform recently?
Data from Farside Investors shows US spot Bitcoin ETFs experienced a mixed week with two days of inflows and two days of outflows, but finished with net weekly inflows of $576.5 million as of the latest reporting.


Be the first to comment