
In this article4 sections
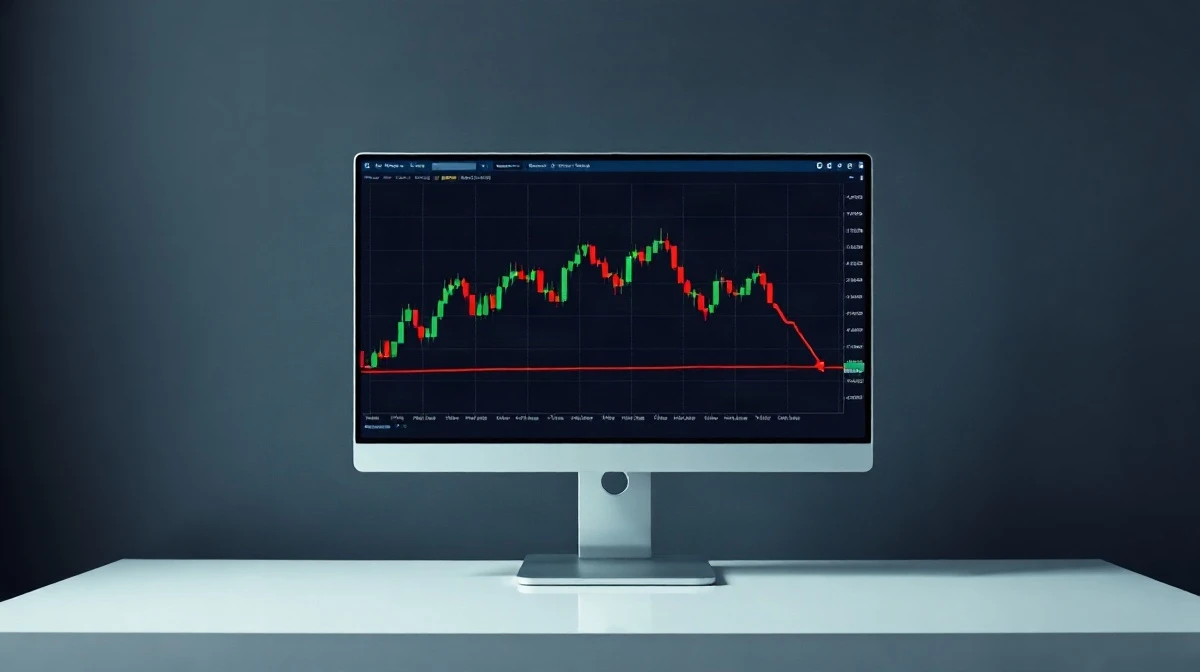
Bitcoin traded in a narrow band around $82,550 to $83,000 on Monday, Oct. 12, 2026, according to a technical review by News.bitcoin, with a 24-hour range of $82,550 to $84,231. The report described a market that has repeatedly failed to reclaim $84,000, handing bears a modest edge while leaving the longer-term recovery structure intact.
Market capitalization stood near $1.673 trillion alongside roughly $23 billion in daily trading volume. That combination of heavy turnover and stalled price action is what defines the current setup: plenty of participation, no agreement on direction.
Also read: Strategy Buys 1,665 Bitcoin for $142.7M, Holdings Hit 847,666 BTC
Key facts
- Bitcoin’s 24-hour range on Oct. 12, 2026 was $82,550 to $84,231, after a local high of $84,254.
- Oscillators read eight neutral, two negative and one positive; RSI sat at 51, Stochastic at 42 and CCI at minus 61.
- The ADX registered 32, momentum minus 1,510, MACD 797 and bull bear power 168.
- Daily moving averages showed nine positive readings against five negative and one neutral, with the 50-period EMA at $80,136 and the 200-period SMA at $72,052.
- Strategy expanded its bitcoin treasury to 848,250 BTC after buying another 250 BTC for approximately $21.5 million, per News.bitcoin.
Where the charts disagree
The hourly picture is the weakest of the three timeframes. After failing at $84,254, a run of lower highs and bearish candles pushed price back toward $83,000. Notably, volume declined as it fell, which suggests the selling has not yet become a convincing breakdown. Below the market, immediate support sits between $82,700 and $83,000; above it, resistance appears near $83,500, then $84,000 and $84,254. A loss of $82,700 would open $82,250 and potentially $81,800.
The four-hour chart is more constructive. Bitcoin recovered from $80,308 and climbed toward $84,000, only to meet repeated resistance between $83,800 and $84,000. Recent candles show fading momentum without a decisive downtrend. Support between $82,500 and $82,800 is the line that matters here; clearing $84,000 would bring $84,500 and $85,000 into view, while a break under $82,500 would turn attention to $81,500 and then $80,308.
Also read: Saylor's 'More Orange' Post Signals Another Strategy Bitcoin Buy
On the daily chart, the broader recovery is still alive. Bitcoin remains well above September’s $74,913 low but beneath its more recent $87,374 peak, having retreated from about $86,500 toward $80,000 before recovering. The $80,000 to $81,000 zone is substantial support, and $84,000 to $85,000 forms the immediate resistance corridor. A daily close above $85,000 would strengthen the bullish case and put $86,500 and $87,374 in range; losing $80,000 would expose $78,000 and potentially $74,913.
Why it matters
The moving averages explain why this is a stalemate rather than a breakdown. Bitcoin is trading close to its 20-period EMA at $83,231, with the 10-period EMA at $83,509 and the 20-period SMA at $84,071 sitting just overhead as nearby obstacles. Nine positive daily MA readings against five negative means the intermediate trend still favors holders, even as short-term momentum fades. Momentum at minus 1,510 and MACD at 797 both carry negative signals, which is why the $82,500 to $84,000 corridor has become the battleground. For traders, the practical read is simple: the longer-term structure has not broken, but neither side has won.
What to watch
The next directional signal depends on two levels. A sustained move beyond $84,000 would shift focus to $84,500 and $85,000, while a breakdown beneath $82,500 would put $81,500 and the $80,308 swing low back in play. A daily close above $85,000 would be the clearest confirmation of renewed upside momentum. None of this is financial advice, and cryptocurrency markets are volatile and uncertain.
Reported by news.bitcoin.com.
Source: Bitcoin.com News