

Bitcoin’s sudden surge past $76,000 on April 14, 2026, sent shockwaves through crypto markets. The move triggered massive liquidations and sparked hopes of a new rally. But a closer look at the data suggests this may have been a classic bull trap—a false signal designed to lure optimistic buyers before a reversal.
The Anatomy of a Sudden Bitcoin Rally
On Tuesday, Bitcoin’s price broke through the $76,000 barrier for the first time in over two months. According to data from Cointelegraph, this single move liquidated approximately $285 million in leveraged short positions. The rally wasn’t isolated. It moved in near lockstep with major equity indices, particularly the S&P 500.
This correlation points to a macroeconomic catalyst. Market analysts note that investor sentiment was buoyed by shifting expectations for U.S. monetary policy. The simultaneous rise in traditional safe-haven assets like gold added another layer of complexity. What this means for traders is that Bitcoin’s price action is increasingly tied to broader financial currents, not just crypto-specific news.
Geopolitical Stress and Inflationary Pressures
The rally coincided with heightened tensions in the Middle East. Oil prices, specifically Brent crude, peaked near $104 per barrel over the weekend before stabilizing around $95. High energy costs directly feed into inflation metrics. This limits the ability of central banks, including the U.S. Federal Reserve, to cut interest rates aggressively.
Also read: Spain’s CNMV Chair Rules Out MiCA Deadline Extension for Crypto Firms, Impacting Binance
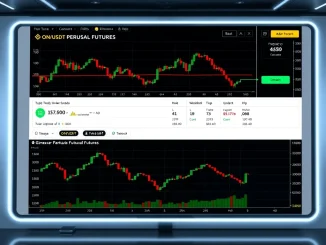
An inverted chart of crude oil prices shows a high intraday correlation with Bitcoin’s movement during this period. The implication is clear: investors may have been flocking to scarce assets as a hedge. “When traditional inflation hedges like bonds lose their appeal due to potential rate cuts, assets with limited supply become more attractive,” one market strategist explained, speaking on background. This dynamic can create powerful, yet potentially fleeting, price spikes.
The Federal Reserve’s Important Role
Monetary policy provides critical context. Data from the St. Louis Fed shows the U.S. central bank’s balance sheet began expanding again in January 2026. This reversed a two-year trend of contraction. Balance sheet expansion increases liquidity in the financial system, which historically supports riskier assets like stocks and cryptocurrencies.
Financial institutions gain easier access to capital. The pressure to sell U.S. Treasuries eases. This environment can fuel short-term rallies across risk markets. However, it’s a double-edged sword. The same liquidity can vanish if the Fed’s outlook changes or if inflation proves more stubborn than expected.
Dissecting the Bull Trap Hypothesis
A bull trap occurs when a declining asset shows a convincing sign of recovery, drawing in buyers, only to resume its downward trend. Several data points from last week’s action raise this possibility for Bitcoin.
Key warning signs included:
- Lack of Sustained Momentum: The price failed to hold above $76,000, suggesting strong selling pressure at that level.
- Macro-Driven vs. Organic Demand: The rally was almost entirely correlated with S&P 500 futures. Independent, crypto-native buying volume appeared lacking.
- Liquidation Fuel: A significant portion of the upward move was amplified by the forced closure of leveraged short bets, not necessarily new long-term investment.
This suggests the rally was more technical than fundamental. For holders who bought near the local bottom around $66,500, a move to $80,000 represents a modest 20% gain. Industry watchers note that such a meager potential upside, after months of consolidation, offers little incentive to take profits quickly. But it also may not be enough to attract the wave of new capital needed for a sustained breakout.
What the Data Says About Future Price Action
The immediate future hinges on a clash of forces. On one side, expansionary monetary policy and persistent inflation create a supportive backdrop for scarce assets. On the other, high oil prices threaten economic growth and could force the Fed to maintain a restrictive stance for longer.
The odds of continued sell pressure on Bitcoin appear low unless there is a sudden, sharp drop in oil prices. Yet, the path to a stable rally above $80,000 is not clear. The market seems to be waiting for a clearer signal—either a decisive break in inflation data or a more committed dovish turn from the Fed.
Conclusion
Bitcoin’s brief rally to $76,000 serves as a potent case study in modern market dynamics. Driven by macro forces and leveraged trading, it exhibited hallmarks of a bull trap. The data reveals a market caught between inflationary fears and liquidity hopes. While the conditions for a major collapse aren’t present, the evidence for an unimpeded bull run is equally thin. Investors should watch oil prices and Fed commentary closely. The next major move will likely depend on which of those two forces gains the upper hand.
FAQs
Q1: What is a bull trap in trading?
A bull trap is a false signal indicating a declining asset has reversed into a bull market, enticing buyers, before the price falls again, trapping those buyers in losing positions.
Q2: Why did Bitcoin’s price rise alongside the S&P 500?
The rally was likely driven by shared macroeconomic factors, primarily shifting expectations for U.S. interest rates and Federal Reserve liquidity, affecting both traditional and crypto risk assets simultaneously.
Q3: How do high oil prices affect Bitcoin?
High oil prices can increase inflation. This may push investors toward scarce assets like Bitcoin as a hedge, but it can also slow economic growth, creating conflicting pressures on its price.
Q4: What does Federal Reserve balance sheet expansion mean for crypto?
When the Fed expands its balance sheet, it injects liquidity into the financial system. This excess liquidity often flows into riskier assets, including cryptocurrencies, potentially boosting their prices.
Q5: What should I look for to see if the Bitcoin rally is real?
Look for sustained buying volume that is independent of stock market moves, a successful hold above key resistance levels (like $76,000), and broader adoption metrics beyond short-term speculative trading.


Be the first to comment