Global, May 2025: The Solana blockchain’s native token, SOL, faces heightened scrutiny from traders and analysts after a significant technical development. The Solana price has breached a critical three-day support trendline, a move that historically signals potential shifts in market structure and increases the risk of a deeper correction. This breach places immediate focus on two crucial price levels: $74 and $50, as market volatility rigorously tests the resilience of the recent bullish momentum.
Solana Price Breach: Analyzing the Technical Breakdown
Technical analysis provides a framework for understanding market psychology through price action and chart patterns. The three-day chart timeframe is particularly significant for institutional and long-term traders, as it smooths out daily noise while capturing broader trend movements. A support trendline on this timeframe is drawn by connecting a series of higher lows, representing a dynamic floor where buying interest has consistently emerged. The breach of this line indicates that selling pressure has overwhelmed this established support, potentially shifting the balance of power from buyers to sellers.
This is not an isolated event but occurs within a specific context. The breach follows a period of sustained upward movement for Solana, which saw the asset recover significantly from previous market downturns. Analysts note that such breaks often trigger automated sell orders and can lead to a reassessment of risk by large holders, known as whales. The immediate consequence is increased selling volume, which can accelerate a downward move if not met with substantial new buying interest at lower levels.
Critical Price Levels: The $74 and $50 Scenarios
Following the trendline breach, market attention turns to specific price zones that could act as the next lines of defense or acceleration points. The first major level is the $74 region. This price point is significant for several reasons. It often corresponds with a previous resistance level that later turned into support, a common phenomenon in technical analysis. Furthermore, it may align with a key Fibonacci retracement level—a tool traders use to identify potential reversal zones based on mathematical ratios derived from the prior price swing.
If selling pressure persists and the $74 level fails to hold, the focus shifts dramatically toward the $50 zone. This represents a more substantial correction and would imply a retracement of a larger portion of Solana’s recent gains. The $50 level is psychologically important and often coincides with long-term moving averages, such as the 200-day simple moving average, which many traders watch as a primary bull/bear market divider. A test of this area would likely involve high volatility and significant trading volume.
- $74 Level: Acts as immediate support; a hold here could consolidate the market and establish a new base.
- $50 Level: Represents a deeper, structural support zone; a breach here could signal a more prolonged bearish phase.
- Volume Confirmation: The validity of any bounce or breakdown at these levels depends heavily on accompanying trading volume.
Historical Context and Market Psychology
Solana has experienced similar technical breakdowns in its history, each with varying outcomes. For instance, in 2023, a break of a major support level led to a swift 40% decline before finding a durable bottom and beginning a new uptrend. These historical precedents do not predict the future but inform the range of possible outcomes and the importance of risk management. Market psychology during these phases often shifts from greed and optimism to fear and caution, which can be observed in derivatives markets through metrics like the funding rate for perpetual swaps and the put/call ratio for options.
The broader cryptocurrency market context is also crucial. Solana does not trade in a vacuum. Its price action is correlated, though not perfectly, with major assets like Bitcoin and Ethereum. A period of weakness or strength in the wider digital asset market will exert a gravitational pull on SOL. Therefore, analysts are simultaneously monitoring Bitcoin’s ability to hold its own key levels, as a failure there could exacerbate selling pressure across the altcoin sector, including Solana.
Volatility Tests Bullish Momentum
The current environment is defined by elevated volatility. Volatility is a statistical measure of the dispersion of returns for an asset and is a double-edged sword. It can signify opportunity for traders but also represents increased risk. The bullish momentum that propelled Solana higher is now being tested by this volatility. Momentum indicators, such as the Relative Strength Index (RSI) and the Moving Average Convergence Divergence (MACD), are watched closely for signs of weakening bullish strength or the emergence of bearish divergence.
On-chain data provides another layer of insight. Metrics like the number of active addresses, transaction volume, and the movement of tokens to and from exchanges can indicate whether the break is accompanied by fundamental network changes or is primarily a speculative market event. A healthy network with growing usage may provide a fundamental cushion against purely technical selling.
| Metric | Current Status | Implication |
|---|---|---|
| 3-Day Support Trendline | Breached | Bearish near-term signal |
| RSI (14-period) | Neutral to Oversold Territory | Potential for short-term bounce if oversold |
| Exchange Net Flow | Monitoring for Inflows | Increased inflows suggest selling pressure |
| BTC Correlation | High | Broader market trend is a key driver |
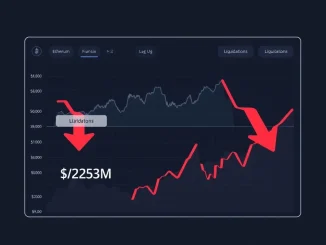
The Role of Derivatives and Liquidity
The derivatives market plays an increasingly important role in price discovery. Large liquidations of leveraged long positions can fuel downward moves, creating a cascade effect. Conversely, if many short positions are opened betting on the decline, a sudden price rebound can trigger a short squeeze, leading to a rapid upward move. Monitoring the levels of liquidations and open interest in futures markets is therefore essential for understanding potential acceleration points in either direction. Liquidity, or the ease with which an asset can be bought or sold without affecting its price, can thin out during volatile periods, leading to more pronounced price swings.
Conclusion
The breach of Solana’s critical three-day support trendline marks a pivotal technical moment, elevating the risk of a price correction. The market’s immediate focus rests on the $74 and $50 support levels, which will serve as key indicators of buyer conviction. While technical analysis highlights these risks, the ultimate price direction will be determined by a combination of broader cryptocurrency market trends, on-chain network health, and shifts in market sentiment. For observers and participants, this period underscores the inherent volatility of digital assets and the importance of a disciplined, data-informed approach to navigating market structure shifts. The coming weeks will be critical in determining whether this breach is a temporary setback or the beginning of a more significant trend change for Solana.
FAQs
Q1: What does it mean that Solana broke its three-day support trendline?
It means the price has fallen below a line connecting its recent lowest points on a three-day chart. This is a technical signal that suggests the prior uptrend may be weakening and that selling pressure has increased, raising the probability of a further price decline.
Q2: Why are the $74 and $50 price levels so important for SOL?
These levels are identified as areas where buying interest may historically emerge. $74 is a nearer-term support zone from previous trading, while $50 represents a more significant, long-term support level that aligns with key technical indicators like major moving averages. They are watched as potential floors for any correction.
Q3: Does this trendline break guarantee Solana’s price will drop further?
No, technical analysis does not provide guarantees, only probabilities. A break signals increased risk but does not dictate the future. The price could rebound from a new support level, or the break could be a “false breakdown” if buyers quickly regain control.
Q4: How does Bitcoin’s performance affect Solana’s price in this situation?
Cryptocurrency markets are highly correlated. If Bitcoin enters a corrective phase or experiences significant selling pressure, it typically creates headwinds for major altcoins like Solana, potentially amplifying any downward move. Conversely, Bitcoin strength can help stabilize the market.
Q5: What should investors look at beyond the price chart?
Beyond technicals, investors monitor on-chain metrics (active addresses, transaction volume), network development progress, broader macroeconomic conditions, and sentiment indicators in derivatives markets to get a holistic view of Solana’s health and potential price drivers.