Price Surge: Decoding the Ascending Triangle and Accumulation Signals")
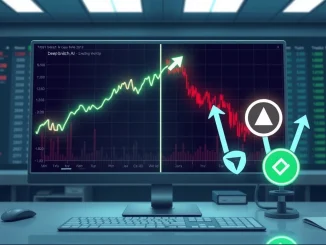
Global, May 2025: The cryptocurrency market is observing a notable technical development in Yei Finance (CLO), with on-chain and chart data suggesting a phase of accumulation. Following a significant bounce from recent lows, market analysts are scrutinizing a classic chart pattern—the ascending triangle—which historically precedes substantial breakouts. This analysis explores the mechanics of this setup, the underlying market behavior, and what it could signal for CLO’s trajectory, without speculative hype.
Yei Finance (CLO) Price Action and Recent Market Context
Yei Finance, operating under the ticker CLO, is a decentralized finance (DeFi) protocol focused on yield optimization and cross-chain liquidity. Like many altcoins, its price is subject to broader market sentiment and specific protocol developments. In recent weeks, CLO’s price chart has formed a structure that technical analysts recognize as a potential reversal or continuation pattern. The “notable bounce” referenced in market reports refers to CLO finding strong buying support at a key level, halting a previous downtrend and establishing a foundation for consolidation. This price action occurs within a complex ecosystem where investor behavior, protocol upgrades, and liquidity flows all interact to influence valuation.
The Anatomy of an Ascending Triangle Pattern
An ascending triangle is a common chart pattern used in technical analysis across all financial markets, from stocks to forex to cryptocurrencies. It is typically considered a bullish formation. The pattern is defined by two key trendlines.
- Horizontal Resistance Line: This line connects a series of similar price highs, indicating a level where selling pressure has consistently emerged to prevent further upward movement.
- Ascending Support Line: This line connects a series of higher lows, sloping upward. It indicates that buyers are stepping in at progressively higher prices, demonstrating increasing demand and accumulation.
The convergence of these lines forms a triangle. The pattern suggests that buying pressure is gradually absorbing the selling pressure at the resistance level. Each test of resistance weakens it, while the rising support shows sustained buying interest. A confirmed breakout occurs when the price closes decisively above the horizontal resistance on significant volume, often leading to a move whose projected magnitude is roughly the height of the triangle at its widest point.
Historical Precedence and Pattern Reliability
While no pattern guarantees future performance, ascending triangles have a documented history in financial analysis. Their psychological interpretation is straightforward: they represent a battle between bulls and bears where the bulls are slowly gaining the upper hand. The horizontal resistance acts as a supply zone, where previous sellers may look to exit. The rising lows indicate that new buyers are willing to acquire assets at higher prices, absorbing this supply. In cryptocurrency markets, which are often driven by sentiment and momentum, the recognition of such a pattern by a large number of traders can become a self-fulfilling prophecy, as buy orders cluster around the anticipated breakout level.
Interpreting “Signs of Accumulation” in Cryptocurrency
The term “accumulation” refers to a phase where informed or institutional investors are believed to be steadily acquiring an asset over time, often during periods of low prices or sideways movement, before a major upward move. For cryptocurrencies like CLO, signs are not limited to chart patterns. They can include:
- On-Chain Metrics: An increase in the number of large transactions (whale activity) moving tokens to long-term storage wallets, as opposed to exchange hot wallets.
- Exchange Netflow: A sustained trend of tokens flowing off centralized exchanges, reducing immediate sell-side liquidity.
- Holder Growth: A steady increase in the number of unique addresses holding the asset, suggesting broader distribution and conviction.
- Funding Rates: In markets with perpetual futures, neutral or slightly negative funding rates during a price rise can indicate spot-driven buying rather than leveraged speculation.
When a recognizable technical pattern like an ascending triangle coincides with these on-chain signals, it provides a more robust, multi-faceted thesis for a potential trend change.
Analyst Projections and Risk Management Considerations
The analyst projection of a “50% price surge” is derived from the measured move technique common in pattern trading. By calculating the vertical distance between the initial high (resistance) and the initial low (start of the ascending support) of the triangle, analysts project that distance upward from the point of breakout. It is a theoretical target, not a promise. Several critical factors must align for this target to be realistic:
- Breakout Confirmation: The price must close above resistance with conviction, typically accompanied by a surge in trading volume. A weak, low-volume breakout is often a false signal.
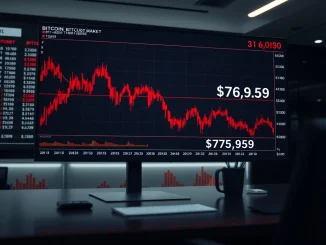
- Market Context: A bullish move in CLO would be significantly aided by a neutral or bullish backdrop for Bitcoin and the broader crypto market. A severe market downturn can invalidate any altcoin pattern.
- Protocol Fundamentals: Positive developments within the Yei Finance ecosystem, such as successful upgrades, partnership announcements, or growth in Total Value Locked (TVL), would provide fundamental support for a technical breakout.
Responsible analysis always couples bullish patterns with clear risk parameters. For traders observing this setup, a logical invalidation point would be a breakdown below the ascending support trendline, which would negate the pattern’s premise.
The Role of Market Structure and Liquidity
Modern cryptocurrency markets are deeply influenced by liquidity and market structure. The horizontal resistance in an ascending triangle often aligns with a prior liquidity pool—a price zone where many stop-loss orders or limit sell orders are clustered. A successful breakout can trigger these orders, creating a rapid, volatile move upward (a liquidity grab). Conversely, the rising support line represents areas where buyers have consistently shown demand. Understanding these dynamics is crucial for separating genuine technical analysis from simple pattern recognition.
Conclusion: A Pattern Worth Monitoring
The formation of an ascending triangle in Yei Finance (CLO) presents a clear, textbook scenario for market technicians and interested observers. It encapsulates a narrative of growing buyer confidence clashing with established resistance. While the pattern suggests the potential for a significant CLO price surge if a high-volume breakout occurs, it remains one piece of a larger puzzle. Investors and traders should consider this technical setup alongside fundamental developments in the DeFi sector, broader market conditions, and concrete on-chain data. In the volatile world of cryptocurrency, disciplined analysis of patterns like the ascending triangle provides a framework for understanding market psychology, but it must be tempered with rigorous risk management and a focus on verifiable facts.
FAQs
Q1: What is an ascending triangle pattern in crypto trading?
An ascending triangle is a bullish chart pattern characterized by a flat upper resistance line and a rising lower support line. It indicates that buyers are becoming more aggressive, pushing the price up to test resistance repeatedly until a potential breakout occurs.
Q2: How reliable is the ascending triangle for predicting price moves?
No pattern is 100% reliable. The ascending triangle is a well-established tool in technical analysis, but its success depends on confirmation (a strong breakout with high volume) and the overall market context. It should be used in conjunction with other indicators.
Q3: What does “accumulation” mean for a cryptocurrency like CLO?
Accumulation refers to a phase where investors are believed to be buying and holding an asset steadily, often out of the public eye. Signs include large transactions moving to cold storage, tokens leaving exchanges, and an increase in long-term holders, all suggesting building demand.
Q4: What would invalidate the bullish CLO ascending triangle setup?
The primary invalidation would be a price decline that breaks and closes below the ascending support trendline. This would signal that buying pressure has failed, and the pattern is no longer valid, potentially leading to a move lower.
Q5: Should the projected 50% surge be considered a financial forecast?
No. The 50% figure is a common measured move target derived from the pattern’s geometry. It is a hypothetical projection used in technical analysis, not a guaranteed outcome. Actual price movement depends on numerous unpredictable market factors.