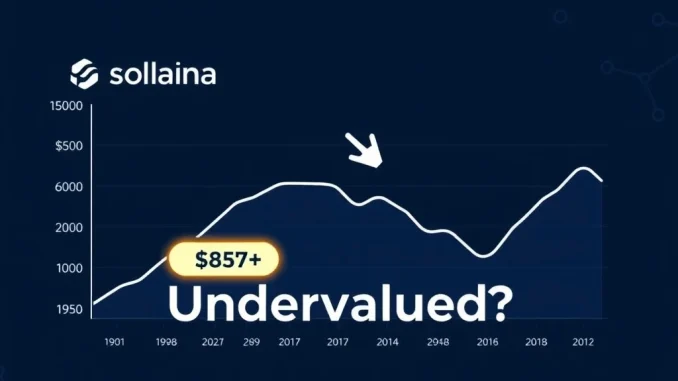
Litecoin (LTC) price chart showing a significant trendline breakout with surging trading volume, indicating strong bullish momentum.
Blockchain News

Litecoin: Explosive Breakout Imminent? LTC Price Surges 440% Amidst Key Technical Signals

The cryptocurrency world is buzzing with anticipation as Litecoin (LTC) approaches a pivotal moment, retesting a resistance trendline that has held for seven long years. This critical juncture, marked by a symmetrical triangle pattern, has compressed LTC’s price within an increasingly narrow range, setting the stage for a potentially monumental move. With a staggering 440% […]

A visual representation of Bitcoin's price at a critical juncture, showing key Bitcoin resistance and support levels on a chart.
Bitcoin News

Bitcoin’s Crucial Crossroads: Navigating $115,000 Resistance and Support for the Next Price Move

The cryptocurrency world is abuzz as Bitcoin’s price finds itself at a pivotal $115,000 crossroads. This isn’t just another trading range; it’s a high-stakes standoff where every move counts. Will the digital gold break free and surge, or will it succumb to bearish pressures? Understanding the intricate dance between key resistance and support levels is […]

Bitcoin price chart showing a crucial moment where BTC tests its 100-day EMA, signaling a potential market correction.
Bitcoin News

Bitcoin Price: Urgent Warning as BTC Nears Critical $103K Test

The cryptocurrency market watches with bated breath. Bitcoin price faces a pivotal moment, with analysts highlighting a critical technical indicator. Many observers are monitoring the 100-day Exponential Moving Average (EMA) on its daily chart. This level could dictate short-term price movements for BTC. Bitcoin Price: The Critical 100-Day EMA Test Bitcoin price currently hovers near […]

Chart showing XRP price decline with a cup-and-handle pattern, signaling a potential bear market. Investors analyze XRP price trends.
Uncategorized

XRP Price Alert: Unveiling the Critical Cup-and-Handle Pattern Amidst 17% Drop

The cryptocurrency market is a dynamic arena, and XRP price has once again captured headlines with a significant downturn. As investors grapple with a more than 17% drop from its annual high, a critical technical formation—the cup-and-handle pattern—has emerged, signaling a potentially challenging period ahead. But is this a mere ‘cool-off’ or the harbinger of […]

TIBBIR Price chart displaying a bullish Inverse Head and Shoulders pattern nearing a breakout, indicating potential upward movement.
Uncategorized

TIBBIR Price: Breaks Key Neckline, Inverse Head and Shoulders Pattern Signals Explosive 30% Upside

In the fast-paced world of digital assets, understanding key technical indicators can be the difference between missing an opportunity and capitalizing on it. Currently, all eyes are on TIBBIR Price as it stands at a pivotal moment, hinting at a potentially significant upward movement. Could this be the breakout traders have been waiting for? Decoding […]

A squirrel navigating a complex PNUTUSDT market chart, symbolizing the current bearish trends and volatility.
Uncategorized

PNUTUSDT: Crucial Insights into Bearish Crypto Market Trends

The dynamic world of cryptocurrency is a constant flux of opportunities and challenges. For investors tracking Peanut the Squirrel (PNUTUSDT), the recent market movements have underscored the critical need for a meticulous PNUTUSDT analysis. As market patterns unfold, understanding the underlying technical signals becomes paramount for navigating these volatile waters. Let’s delve into the recent […]