Bitcoin weekly RSI chart showing a drop to 27.8, indicating oversold conditions similar to June 2022.
Uncategorized

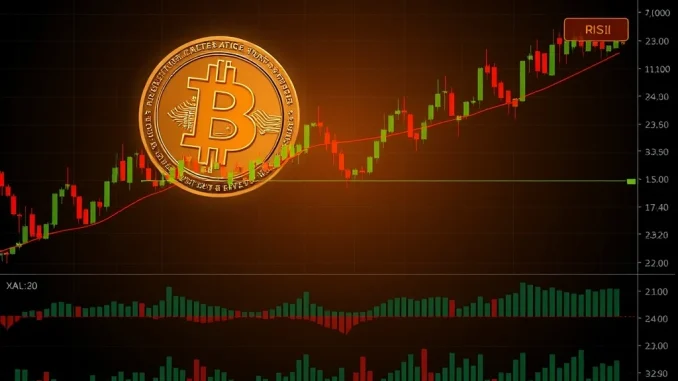
Bitcoin Liquidity Shifts as Weekly RSI Plunges to 2022 Lows

Global Markets, May 2025: Bitcoin experienced significant volatility this week, briefly touching $70,000 before a sharp reversal triggered substantial market liquidations. The most notable technical development emerged as Bitcoin’s weekly Relative Strength Index (RSI) dropped to 27.8, marking its lowest reading since June 2022. This BTC liquidity move during a U.S. bank holiday created a […]

Ethereum price analysis chart highlighting the critical $1,929 support level for a potential liquidity sweep.
Uncategorized

Ethereum Price Analysis: The Critical $1,929 Support Sweep Traders Are Watching

Global, April 2025: The Ethereum price finds itself at a critical technical juncture, trading precariously near the $1,929 support level following a significant weekend sell-off. Market participants are intently focused on whether the price will execute a final “liquidity sweep” of this low before mounting any sustainable recovery toward the $2,107 resistance zone. This price […]

Zcash cryptocurrency price chart analysis showing key resistance level after recent rally.
Uncategorized

Zcash Faces Critical Resistance: What Traders Need to Know After 40% Rally

Global, May 2025: The Zcash cryptocurrency has encountered significant technical resistance following a substantial 40% price rally, creating a pivotal moment for market participants. This development places renewed focus on the $270 support level, which aligns with the crucial 200-day Simple Moving Average. Market analysts are now closely monitoring whether this represents a temporary consolidation […]

Bitcoin price chart analysis showing the 4-year Simple Moving Average and key market cycle signals.
Uncategorized

Bitcoin Nears Critical 4-Year SMA: Decoding the Capitulation and Accumulation Signals

Global, May 2025: Bitcoin, the world’s leading cryptocurrency, is testing a pivotal long-term technical threshold—its 4-year Simple Moving Average (SMA). This event coincides with a notable shift in on-chain behavior, where signals of investor capitulation are diminishing, and patterns of accumulation are gaining strength. Market analysts are scrutinizing this convergence, as historical precedent suggests it […]

Chart analysis of the recurring 120-day altcoin cycle signaling a major market shift for cryptocurrency investors.
Uncategorized

Altcoin 120-Day Cycle Reveals Crucial Market Shift on the Horizon

Global, May 2025: A distinct and recurring 120-day cycle in the altcoin market is drawing intense scrutiny from analysts, as historical data since 2024 suggests a pivotal shift may be imminent. The pattern, characterized by extended downtrends following brief rallies, has brought the Total3 index—which tracks the market capitalization of all cryptocurrencies excluding Bitcoin and […]

XRP technical analysis chart showing price movements and key support levels at $0.65
Uncategorized

XRP Price Analysis: Navigating the ‘Max Pain’ Zone as Traders Watch $0.65 Level

Global Cryptocurrency Markets, April 2025: XRP, the digital asset associated with Ripple Labs, finds itself in what technical analysts describe as a ‘max pain’ zone—a critical juncture where market sentiment and technical indicators conflict, creating uncertainty about the next significant price movement. Following a bounce from the $1.16 support level, XRP currently trades below the […]

RLS cryptocurrency price chart showing technical breakout from descending channel pattern with 7.9% surge
Uncategorized

RLS Cryptocurrency Surges 7.9% After Critical Descending Channel Breakout: Market Analysis

Global, May 2025: The cryptocurrency market witnessed notable technical developments this week as RLS (Rayls) recorded a 7.9% price increase following what technical analysts identify as a breakout from a descending channel pattern. This movement occurs within a broader context of selective altcoin activity, where certain digital assets demonstrate independent momentum despite mixed signals across […]

Chart showing Venice Token VVV price breaking out of a descending channel pattern in a significant rally.
Uncategorized

Venice Token Shatters Descending Channel in Stunning 45.7% Rally, Fueling Bull Run Speculation

Global, April 2025: The cryptocurrency market witnessed a significant technical development this week as Venice Token (VVV) executed a decisive breakout from a prolonged descending channel. This move, which propelled the asset’s price by approximately 45.7% over a short period, has captured the attention of market analysts who now point to a growing accumulation phase […]

Solana price chart analysis showing key 2026 support and resistance levels amid network upgrades.
Uncategorized

Solana Price Outlook 2026: Critical Support and Resistance Levels Define SOL’s Path Amid Network Evolution

Global, May 2025: The Solana blockchain network enters a pivotal phase as its native cryptocurrency, SOL, approaches a decisive technical juncture. Market analysts and network observers now focus intently on two specific price thresholds: the $85.55 resistance and $76.70 support levels. These levels are not arbitrary numbers but represent significant psychological and technical barriers that […]