AAVE price chart analysis showing double bottom pattern and key $111.23 support level for the DeFi token.
Uncategorized

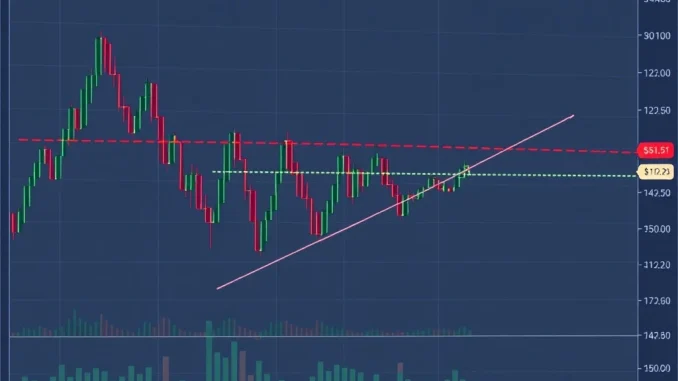
AAVE Price Analysis: Decisive $111.23 Support Holds as Double Bottom and Surging RWA Demand Signal Bullish Reversal

Global, May 2025: The decentralized finance (DeFi) token AAVE is demonstrating notable resilience at a critical technical juncture. Market data shows the AAVE price holding firmly at a combined diagonal and horizontal support trendline near $111.23. This consolidation coincides with the emergence of a potential double bottom pattern on its daily chart, a classic technical […]

Dogecoin price chart testing a key trendline support level as momentum indicators fade.
Uncategorized

Dogecoin’s Critical Test: DOGE Holds Trendline Support as Momentum and Volume Weaken

Global, May 2025: Dogecoin (DOGE) is undergoing a critical technical test, holding a key trendline support level even as its upward momentum and trading volume show signs of weakening. This divergence between price action and underlying market strength presents a complex puzzle for traders and analysts, raising fundamental questions about the sustainability of the meme […]

Analysis chart showing Ethereum price and declining stablecoin reserves indicating a potential market bottom.
Uncategorized

Ethereum’s Critical Bottom Window Emerges as Stablecoin Reserves Plunge 14%

Global, May 2025: The Ethereum network is flashing a significant technical signal as the total value of stablecoin reserves held on major centralized exchanges has fallen sharply by 14%, dropping to approximately $64.5 billion. This substantial withdrawal of liquidity, a key on-chain metric, is leading analysts to identify what they term a “bottom window”—a historical […]

A financial chart displaying the Parabolic SAR indicator for identifying market trends and reversal points.
Ethereum News

Parabolic SAR Indicator: The Essential Guide to Spotting Trends and Reversals

Global, 2025: For traders navigating volatile financial markets, identifying the direction of a trend is a fundamental challenge. The Parabolic SAR indicator stands as a cornerstone technical analysis tool designed to solve this precise problem. Developed by the legendary technical analyst J. Welles Wilder Jr., this indicator provides clear, visual signals for potential trend direction […]

Analytical chart showing BNB price entering a historic undervaluation zone with key technical indicators.
Uncategorized

BNB Undervaluation: The Critical Technical Signals Every Investor Must See

Global, April 2025: Binance Coin (BNB), the native token of the world’s largest cryptocurrency exchange by volume, has entered a statistically significant undervaluation territory, triggering intense scrutiny from market analysts. Current data reveals BNB is trading approximately 37% below its short-term holder realized price, a level that has historically preceded notable price recoveries for the […]

Chart analyzing the Bitcoin vs Gold ratio hitting historic lows, signaling a potential market bottom.
Uncategorized

Bitcoin vs. Gold: Historic Lows in 14-Month Bear Market Signal Potential Turning Point

Global Financial Markets, May 2025: A critical chart watched by macro investors and cryptocurrency analysts is flashing a signal not seen in years. Bitcoin, measured against the timeless benchmark of gold, has weathered a 14-month relative bear market. This prolonged period of underperformance has driven the BTC/Gold ratio—along with key momentum indicators like the Relative […]

Chart showing Happy Cat coin's symmetrical triangle breakout and 15.48% price surge.
Uncategorized

Stunning 15.48% Surge for Happy Cat Coin as Symmetrical Triangle Breakout Fuels Analyst Optimism

Global, May 2025: The cryptocurrency market witnessed a notable price movement today as Happy Cat (HAPPY), a community-driven memecoin, recorded a significant 15.48% gain against the US Dollar. This surge, observed across major trading platforms, coincides with a technical chart pattern known as a symmetrical triangle breakout, which some market analysts interpret as a precursor […]

ASTER cryptocurrency price chart showing consolidation pattern with potential breakout toward $0.81 level
Uncategorized

ASTER Consolidation Reaches Critical Juncture: Will $0.81 Breakout Materialize?

Global Cryptocurrency Markets, May 2025: The ASTER cryptocurrency has entered what technical analysts identify as its most prolonged consolidation phase since establishing its previous trading range between $0.90 and $1.00. This extended period of price compression now approaches a critical technical juncture, with market participants closely monitoring whether the asset will attempt a breakout toward […]

Ethereum daily chart showing a bearish pennant pattern forming between $2,100 and $1,850.
Uncategorized

Ethereum Bearish Pennant: The Critical $2,100 Breakout or $1,850 Breakdown Dilemma

Global, April 2025: Ethereum (ETH), the world’s second-largest cryptocurrency by market capitalization, has entered a critical technical phase. After a significant pullback from its recent highs, ETH price action is compressing into a well-defined bearish pennant pattern near the psychologically important $2,000 level. This tightening consolidation signals that a decisive move is likely imminent, with […]