Bitcoin News
Breaking: HBAR Tests Critical Demand Zone – 3 Key Price Targets Revealed
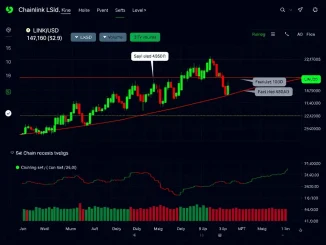
NEW YORK, March 15, 2026 – The native token of the Hedera Hashgraph network, HBAR, is trading within a critical monthly demand zone between $0.064 and $0.045 as of this morning’s Asian session. Market analysts confirm this zone represents a higher time frame retracement area following HBAR’s strong rally from its 2024 cycle lows. Consequently, […]