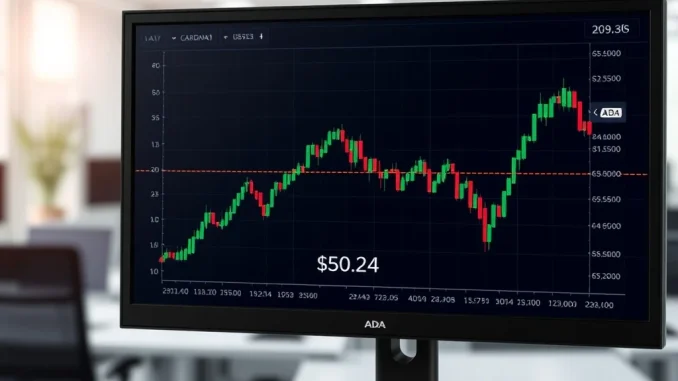
Ethereum price chart analysis showing key support and resistance levels for ETH's next major move.
Uncategorized

Ethereum Breakdown: The Critical Levels That Will Decide Its Next Major Move

Global, May 2025: The Ethereum breakdown persists, with the world’s second-largest cryptocurrency trading perilously close to the $2,042 level. This continued descent underscores a prevailing bearish structure that has market participants scrutinizing specific liquidity zones and technical thresholds. A decisive reclaim of the $2,345 level now stands as the primary marker analysts cite for a […]

Chart showing Solana's critical breakdown of a two-year trendline, signaling a major market structure shift.
Uncategorized

Solana Breakdown: The Critical Market Structure Shift Every Trader Must Understand

Global, April 2025: A significant technical event has unfolded in the cryptocurrency markets. Solana (SOL), one of the leading blockchain platforms by market capitalization, has decisively broken below a major two-year rising trendline on its daily chart. This Solana breakdown represents more than a simple price correction; it signals a potential fundamental shift in the […]

XRP price chart showing a critical triangle pattern formation with potential 11% breakout near key $1.60 resistance.
Uncategorized

XRP Triangle Pattern Signals Critical Juncture – Technical Analysis Points to Potential 11% Breakout

Global, May 2025: The XRP market approaches a decisive technical juncture as price action consolidates into a critical triangle pattern near the $1.60 level. This formation, occurring alongside notable inflows into cryptocurrency exchange-traded funds (ETFs), suggests heightened potential for volatility and a possible directional breakout in the coming sessions. Technical analysts are closely monitoring the […]

Dogecoin price chart analysis showing breakout potential amid increased network activity with 36% surge
Uncategorized

Dogecoin Breakout Potential: 30% Surge Looms as Network Activity Spikes 36%

Global, April 2025: Dogecoin, the original memecoin that evolved into a serious digital asset, is showing technical signals that suggest potential for significant price movement. Current trading around $0.1057 coincides with a substantial 36% increase in network usage, creating conditions that technical analysts are monitoring for a possible 30% breakout. This development occurs within a […]

PENGU token 12-hour chart showing TD Sequential buy signal, analysis for potential rebound.
Uncategorized

PENGU Token Signals Potential Rebound: TD Sequential Buy Flash Hints at 30% Recovery

Global Cryptocurrency Markets, April 2025: The PENGU token, the native cryptocurrency of the popular Pudgy Penguins non-fungible token (NFT) ecosystem, has generated notable attention among technical analysts. A specific chart pattern, known as a TD Sequential buy signal, has appeared on its 12-hour price chart. This development occurs as the broader Pudgy Penguins project tests […]