Analyst chart comparing the best altcoins to buy: Avalanche, Polkadot, and AI-focused DeepSnitch.
Uncategorized

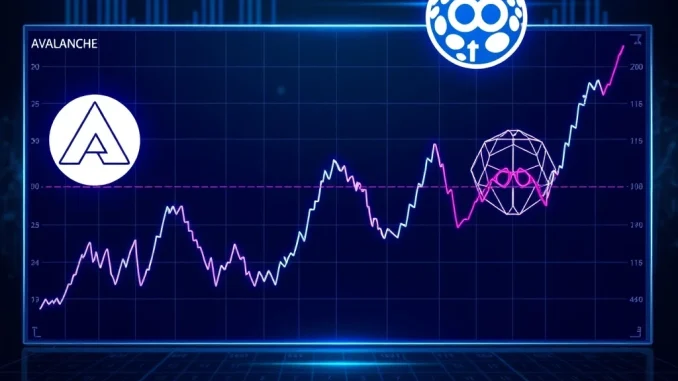
Best Altcoins to Buy: Avalanche Targets $10, Polkadot Seeks Recovery, While DeepSnitch AI Captures Trader Focus

Global, May 2025: The cryptocurrency market continues to present a dynamic landscape for investors, with established layer-1 blockchains and emerging utility-focused projects vying for attention. Current analysis highlights Avalanche (AVAX) as it approaches a significant technical threshold, Polkadot (DOT) navigating a path toward market recovery, and a notable shift in trader sentiment toward projects like […]

Countdown to ZKP presale auction end with cryptocurrency market charts for Monero and Cardano in background.
Uncategorized

ZKP Presale Auction Enters Final 5-Day Countdown as Monero and Cardano Show Parallel Market Activity

Global, April 2025: The second-stage presale auction for the ZKP protocol token is entering its final five-day phase, a development that coincides with notable price movements for established cryptocurrencies like Monero and Cardano. This convergence of events highlights the ongoing evolution of token distribution models and their interplay with broader market trends. Understanding the ZKP […]

RLS cryptocurrency price chart showing technical breakout from descending channel pattern with 7.9% surge
Uncategorized

RLS Cryptocurrency Surges 7.9% After Critical Descending Channel Breakout: Market Analysis

Global, May 2025: The cryptocurrency market witnessed notable technical developments this week as RLS (Rayls) recorded a 7.9% price increase following what technical analysts identify as a breakout from a descending channel pattern. This movement occurs within a broader context of selective altcoin activity, where certain digital assets demonstrate independent momentum despite mixed signals across […]

Chart showing Venice Token VVV price breaking out of a descending channel pattern in a significant rally.
Uncategorized

Venice Token Shatters Descending Channel in Stunning 45.7% Rally, Fueling Bull Run Speculation

Global, April 2025: The cryptocurrency market witnessed a significant technical development this week as Venice Token (VVV) executed a decisive breakout from a prolonged descending channel. This move, which propelled the asset’s price by approximately 45.7% over a short period, has captured the attention of market analysts who now point to a growing accumulation phase […]

Solana price chart analysis showing key 2026 support and resistance levels amid network upgrades.
Uncategorized

Solana Price Outlook 2026: Critical Support and Resistance Levels Define SOL’s Path Amid Network Evolution

Global, May 2025: The Solana blockchain network enters a pivotal phase as its native cryptocurrency, SOL, approaches a decisive technical juncture. Market analysts and network observers now focus intently on two specific price thresholds: the $85.55 resistance and $76.70 support levels. These levels are not arbitrary numbers but represent significant psychological and technical barriers that […]

Technical analysis chart showing an ascending triangle pattern for Yei Finance (CLO) cryptocurrency price.
Uncategorized

Yei Finance (CLO) Price Surge: Decoding the Ascending Triangle and Accumulation Signals

Global, May 2025: The cryptocurrency market is observing a notable technical development in Yei Finance (CLO), with on-chain and chart data suggesting a phase of accumulation. Following a significant bounce from recent lows, market analysts are scrutinizing a classic chart pattern—the ascending triangle—which historically precedes substantial breakouts. This analysis explores the mechanics of this setup, […]

Social media analytics dashboard showing top DeFi projects including Solana, XRP, and Chainlink
Uncategorized

DeFi Projects Today: The Surprising Social Activity Leaders Revealed

Global, May 2025: New data from social analytics platform LunarCrush reveals significant shifts in cryptocurrency community engagement, with Solana ($SOL) emerging as the clear leader in social activity among decentralized finance (DeFi) projects. The analysis, which tracks millions of social interactions across platforms including Twitter, Reddit, and Telegram, shows XRP ($XRP) and Chainlink ($LINK) following […]

Bitcoin price chart highlighting the critical 21-day moving average and key support zone for technical analysis.
Uncategorized

Bitcoin’s Critical Test: Analysts Watch for Decisive 21-Day Moving Average Breakout

Global, May 2025: Bitcoin is currently testing a critical technical juncture, holding above a vital support zone while market participants closely monitor its interaction with the 21-day moving average. This specific technical indicator has historically served as a key signal for intermediate-term momentum shifts, making its current position a focal point for analysts and traders […]