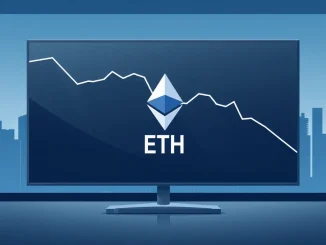
January 21, 2026 – The cryptocurrency market experienced significant volatility this week, with Solana (SOL) dropping below the critical $130 support level for the first time since early January. This price movement has created uncertainty among traders and investors, yet a deeper examination of blockchain data reveals a strikingly different narrative developing beneath the surface. While short-term price action appears bearish, fundamental on-chain metrics indicate substantial accumulation by large holders and strengthening network fundamentals that could signal an impending market reversal.
Solana Price Correction Amid Market-Wide Downturn
The recent decline in Solana’s valuation reflects broader market conditions affecting the cryptocurrency sector. Following a sustained rally throughout late 2025, many digital assets have entered a correction phase characterized by profit-taking and reduced risk appetite among institutional investors. Solana’s drop to approximately $120 in late December 2025 represented a 22% decline from its monthly high, triggering technical sell signals across multiple trading platforms.
Market analysts note that this correction aligns with historical patterns observed after extended bullish periods. The cryptocurrency market typically experiences consolidation phases where weaker hands exit positions while long-term investors increase their exposure. Technical indicators showed increased selling pressure as SOL breached several key support levels, with trading volume spiking during the decline. However, this price movement occurred alongside contradictory fundamental developments that merit careful examination.
Technical Analysis Context
Technical charts reveal that Solana’s decline below $130 marked a significant psychological threshold for traders. The asset had maintained this level since January 2, 2026, creating expectations of continued support. When this level failed, automated trading systems triggered additional sell orders, exacerbating the downward momentum. Despite this technical breakdown, blockchain data tells a more nuanced story about actual investor behavior versus price reaction.
On-Chain Metrics Reveal Substantial Whale Accumulation
Blockchain analytics platforms have documented remarkable accumulation patterns among large Solana holders throughout the price decline. Wallets containing between 1,000 and 10,000 SOL tokens have significantly increased their positions since November 2025. These mid-sized whales now control approximately 48 million tokens, representing 9% of Solana’s circulating supply. More significantly, the largest holders—those with over 100,000 SOL—have expanded their collective holdings from 347 million to 362 million tokens during the same two-month period.
This accumulation dynamic represents a substantial shift in token distribution. Large addresses now control 64% of circulating SOL supply, indicating increased concentration among sophisticated investors. The timing of this accumulation is particularly noteworthy because it occurred precisely as retail sentiment turned negative and prices declined. Historical data suggests that such divergence between price action and whale behavior often precedes significant market reversals.
Key accumulation metrics include:
- Weekly net balance for long-term holders reached 3.85 million SOL on January 14, 2026
- This accumulation level represents a 15-month high for sustained buying
- Exchange balances have decreased by 34% since November 2025
- Whale transaction volume increased 42% during the price decline
Exchange Supply Reaches Critical Low Levels
The supply of Solana tokens available on cryptocurrency exchanges has reached its lowest point in two years. As of January 17, 2026, only 26 million SOL remained on trading platforms, representing just 4.9% of the circulating supply. This metric is particularly significant because exchange balances directly influence selling pressure. When tokens move off exchanges into private wallets, they become less available for immediate sale, creating potential supply constraints during periods of increased demand.
Analysts from blockchain intelligence firm Nansen have documented this trend across multiple exchanges. Their data shows consistent withdrawal patterns from centralized platforms to self-custody solutions throughout the price decline. This movement suggests that investors are positioning for longer holding periods rather than preparing for imminent selling. The reduction in readily available supply could amplify upward price movements if buying pressure resumes, creating what market technicians describe as a “supply shock” scenario.
Historical Precedent Analysis
Historical blockchain data reveals similar patterns preceding previous Solana rallies. During the 2023 accumulation phase, exchange balances dropped to 5.2% of circulating supply before SOL’s price increased by approximately 400% over the following six months. While past performance doesn’t guarantee future results, this historical context provides valuable perspective on current market dynamics. The current exchange balance of 4.9% represents an even more extreme supply constraint than observed before previous bull markets.
Network Activity Demonstrates Robust Fundamentals
Despite price weakness, Solana’s network fundamentals have shown remarkable strength. Daily active addresses increased by 51% during the week ending January 17, 2026, surpassing 5 million unique addresses according to Nansen data. This metric measures genuine user engagement rather than speculative trading activity, providing insight into organic network growth. Transaction volume followed a similar trajectory, increasing 20% to reach 78 million daily operations by January 16.
The network has also experienced substantial growth in stablecoin adoption. The total value of stablecoins hosted on Solana increased by 15% in seven days, reaching a record $15 billion. This metric is particularly significant because stablecoins represent liquidity available for trading and decentralized application usage. Analysis from Milk Road suggests this increase “represents new capital entering the ecosystem” rather than simple token migration from other chains.
Network growth indicators include:
- 5.1 million daily active addresses (51% weekly increase)
- 78 million daily transactions (20% weekly increase)
- $15 billion in stablecoin value (15% weekly increase)
- 342,000 new addresses created weekly
Market Structure Analysis and Future Implications
The current divergence between Solana’s price action and fundamental metrics presents a complex market scenario. Technical analysis suggests continued weakness in the short term, with several indicators pointing toward potential further declines. However, blockchain data reveals underlying strength that typically precedes substantial rallies. This contradiction creates what market analysts describe as a “high-conviction divergence”—a scenario where fundamental and technical indicators conflict sharply, often resolving through dramatic price movements.
Market structure analysis reveals that current conditions resemble previous accumulation phases that preceded significant rallies. The combination of whale accumulation, declining exchange supply, and robust network growth creates a foundation for potential upward movement. However, macroeconomic factors including interest rate decisions, regulatory developments, and broader market sentiment will ultimately determine the timing and magnitude of any recovery.
Expert Perspective on Market Dynamics
Blockchain analysts emphasize that current conditions demonstrate sophisticated investor behavior diverging from retail sentiment. While retail traders often react to price movements, institutional investors and large holders typically base decisions on fundamental metrics and long-term outlooks. The current accumulation pattern suggests that knowledgeable market participants view the price decline as a buying opportunity rather than a reason for concern. This behavior aligns with historical patterns where whale accumulation during market corrections preceded substantial returns for patient investors.
Conclusion
Solana’s recent price decline below $130 has captured market attention, yet underlying blockchain metrics reveal a more complex and potentially bullish narrative. Substantial whale accumulation, declining exchange supply, and robust network growth contradict the bearish price action, creating what analysts describe as a high-conviction divergence. While short-term volatility may continue, fundamental indicators suggest strengthening foundations that could support price recovery. The Solana price situation demonstrates the importance of analyzing multiple data dimensions in cryptocurrency markets, where blockchain metrics often provide more reliable signals than price charts alone. Market participants should monitor exchange balances, whale movements, and network activity alongside price action to develop a comprehensive market perspective.
FAQs
Q1: Why is Solana’s price declining despite strong on-chain metrics?
The divergence between price and fundamentals often occurs during market transitions. Technical selling pressure, profit-taking, and broader market conditions can temporarily override positive fundamentals until accumulation reaches critical mass and buying pressure resumes.
Q2: What does declining exchange supply mean for Solana’s price potential?
Reduced exchange supply limits immediate selling pressure and can amplify upward price movements when demand increases. With only 4.9% of circulating supply available on exchanges, even moderate buying could create significant price appreciation due to supply constraints.
Q3: How significant is whale accumulation during price declines?
Historical data shows that whale accumulation during corrections often precedes substantial rallies. Large investors typically possess more information and resources than retail traders, making their accumulation patterns a potentially leading indicator for market direction.
Q4: What network metrics are most important for evaluating Solana’s fundamental health?
Daily active addresses, transaction volume, stablecoin adoption, and developer activity provide the clearest picture of organic network growth. These metrics indicate genuine usage rather than speculative trading activity.
Q5: How long might the divergence between price and fundamentals persist?
Historical divergences have lasted from several weeks to multiple months. The resolution typically depends on broader market conditions, catalyst events, and whether accumulation patterns continue during the divergence period.
Updated insights and analysis added for better clarity.
This article was produced with AI assistance and reviewed by our editorial team for accuracy and quality.