February 1, 2025: The Solana (SOL) network enters a pivotal phase as its native token tests a crucial technical support level at $103. This price point, closely watched by traders and analysts, represents a significant psychological and technical battleground as February trading commences. The market dynamic presents a complex interplay between sustained institutional capital inflows, ongoing network performance upgrades, and persistent technical selling pressure from broader market conditions.
Solana’s $103 Support Level: A Technical and Psychological Battleground
The $103 price level for Solana is not an arbitrary figure. Technical analysts identify it as a major support zone established through previous market cycles. This level acted as a launching pad for a significant rally in Q4 2024 and subsequently served as a floor during the January 2025 consolidation. A decisive break below this support could trigger automated sell orders and shift market sentiment, potentially leading to a test of lower supports near $95 or $88. Conversely, a strong bounce from $103 would reinforce the level’s strength and could signal a resumption of bullish momentum. The concentration of trading volume around this price confirms its importance, making the current test a critical event for short to medium-term price direction.
Institutional Inflows Provide a Fundamental Counterweight
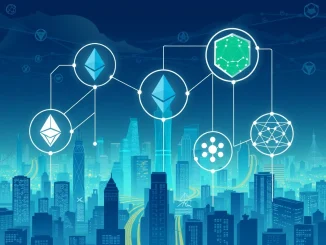
Balancing the technical selling pressure is a notable trend of institutional investment flowing into Solana-based products. Weekly reports from digital asset managers show consistent inflows into Solana exchange-traded products (ETPs) and dedicated funds throughout January, even during periods of price weakness. This activity suggests a longer-term conviction in Solana’s underlying technology and ecosystem growth, separate from short-term price speculation. Analysts point to several factors driving this institutional interest:
- Network Performance: Solana’s high throughput and low transaction costs continue to attract developers building scalable decentralized applications (dApps), particularly in decentralized finance (DeFi) and non-fungible tokens (NFTs).
- Ecosystem Maturation: The total value locked (TVL) in Solana’s DeFi protocols has shown resilience, and key infrastructure projects have launched mainnets, indicating organic growth.
- Regulatory Clarity: Evolving regulatory frameworks in major markets have provided some institutions with greater confidence to allocate capital to established layer-1 blockchains like Solana.
This institutional backing acts as a stabilizing force, potentially providing buy-side liquidity around key support levels like $103.
The Impact of Network Upgrades on Market Perception
Parallel to the price action, the Solana development community is actively rolling out a series of network upgrades. These upgrades, part of the ongoing “Firedancer” roadmap led by Jump Crypto, aim to further enhance network stability, scalability, and decentralization. While the direct impact on token price is not instantaneous, successful implementation of these upgrades strengthens the fundamental investment thesis. Market participants monitor upgrade milestones closely; smooth execution can improve investor confidence and mitigate fears related to past network congestion issues. The current test at $103 is happening in a context where the network’s technical foundation is demonstrably improving, which may influence how traders interpret a hold or break of the support level.
February’s Macro Backdrop and Crypto Correlation
The trading month of February begins amidst a specific macroeconomic landscape that influences all risk assets, including cryptocurrencies. Traders are assessing upcoming economic data releases, central bank commentary, and geopolitical developments. Historically, cryptocurrency markets have shown correlation with traditional risk-on assets like technology stocks, especially in periods of high macroeconomic uncertainty. Therefore, Solana’s battle at $103 is not occurring in a vacuum. Pressure from a broader market sell-off in tech equities could exacerbate selling pressure on SOL, while a “risk-on” shift could provide the tailwind needed for a robust bounce. This external factor adds a layer of complexity to the purely technical and on-chain analysis of Solana’s price action.
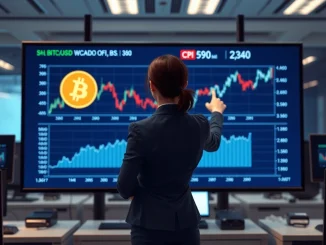
Analyzing On-Chain Data and Derivative Markets
Beyond the spot price, on-chain analytics provide deeper insight into holder behavior. Metrics such as the number of addresses in profit, supply held on exchanges (indicating potential selling pressure), and mean coin age can reveal whether the sell-off is driven by short-term traders or long-term holders. Currently, data suggests accumulation by large holders (“whales”) has increased near the $105-$110 range. Meanwhile, in derivative markets, the funding rate for SOL perpetual swaps has normalized after being slightly negative, indicating that excessive leverage on the short side has been reduced. This reset in derivatives can sometimes precede a period of stabilization or reversal, especially when coupled with a test of major support.
Historical Precedents and Market Cycle Context
Solana has faced similar critical support tests in previous market cycles. Examining these periods reveals patterns in how the asset reacts. For instance, in mid-2023, SOL found strong support at a key level after a prolonged downtrend, which later marked the beginning of a multi-month recovery. The current market structure differs, as Solana is consolidating after a strong 2024, not recovering from a deep bear market. Understanding this context is crucial. A failure to hold $103 now would signal a deeper correction within a broader uptrend, rather than a continuation of a bear market. This distinction influences the potential depth of a breakdown and the probable recovery timeline.
Conclusion: A Convergence of Forces at a Key Juncture
Solana’s test of the $103 support level as February trading begins represents a convergence of multiple market forces. Technical selling pressure from a cautious macro environment is meeting committed institutional inflows and a strengthening fundamental backdrop of network upgrades. The outcome of this test will likely set the tone for SOL’s price action for much of the first quarter of 2025. A successful hold above $103, supported by volume, could validate the bullish institutional thesis and provide a platform for upward movement. A breakdown, however, would force a reassessment of immediate bullish scenarios and shift focus to the next levels of significant support. Regardless of the short-term direction, the activity around this critical $103 support level underscores Solana’s continued prominence and the high-stakes, data-driven nature of modern cryptocurrency markets.
FAQs
Q1: Why is the $103 level so important for Solana?
The $103 level is a major technical support zone identified through historical price action. It has previously acted as both strong resistance and support, meaning a large number of trades and investor interest are focused around this price. A break below could trigger further automated selling.
Q2: What are “institutional inflows” and how do they support the price?
Institutional inflows refer to investments from hedge funds, asset managers, and corporations into financial products tied to Solana, like ETFs/ETPs. This represents long-term, strategic capital that is less likely to be sold on short-term volatility, providing underlying buy-side demand.
Q3: How do network upgrades affect Solana’s market value?
Network upgrades that improve speed, stability, and decentralization enhance the utility and reliability of the blockchain. This strengthens the fundamental case for using and investing in Solana, which can improve long-term investor confidence and attract more developers, indirectly supporting the token’s value.
Q4: What happens if Solana breaks below $103 support?
If Solana experiences a sustained daily or weekly close below $103 with high volume, technical analysis suggests the price could decline further to seek the next major support levels, which analysts identify around $95 and $88. Market sentiment would likely turn more negative in the short term.
Q5: Is February typically a good or bad month for cryptocurrency prices?
There is no consistent seasonal pattern for cryptocurrency prices in February. Performance is more dependent on broader macroeconomic conditions, regulatory news, and asset-specific developments than on the calendar month itself.
This article was produced with AI assistance and reviewed by our editorial team for accuracy and quality.