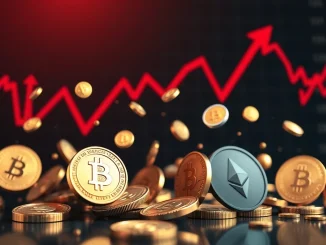
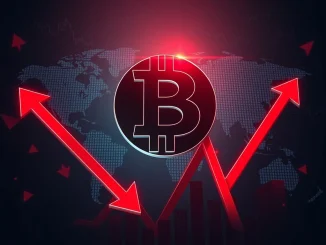
On Monday, March 10, 2026, Ether (ETH) reclaimed the critical $2,000 psychological level as a surge in derivatives activity signaled traders are aggressively targeting a dense cluster of overleveraged short positions overhead. Data from major exchanges shows more than 110,000 ETH flowed into derivatives platforms, marking the third-largest net inflow spike of the year. This intense speculative positioning, concentrated around the $2,030 to $2,100 range where approximately $273 million in short liquidations sit, suggests the market is preparing for a volatile breakout attempt. The key question for analysts now is whether this liquidity grab can propel ETH price toward the next major resistance near $2,500.
Ether Derivatives Inflows Signal Speculative Frenzy
According to data from CryptoQuant, derivative exchanges recorded a net inflow of 110,343 ETH on March 7. This substantial movement of capital into leveraged products represents a clear buildup of speculative bets. Historically, similar spikes in derivatives inflows have frequently preceded periods of sharp price volatility. For instance, a larger inflow event on February 6 preceded a 13% rally from ETH’s yearly low of $1,736. Concurrently, Ether’s estimated leverage ratio—a metric tracking open interest against exchange reserves—climbed to a record 0.78 on Wednesday, March 5, surpassing the previous high set on January 1. A higher leverage ratio indicates traders are employing more borrowed capital, which can amplify price moves in either direction as cascading liquidations occur.
This activity unfolds as Ether consolidates within a monthly trading range between $1,800 and $2,000. The range formed after a swing failure pattern near $2,150 last week triggered profit-taking. The subsequent retracement found support at internal liquidity levels near $1,900, setting the stage for Monday’s bullish pivot on the hourly chart. Market structure now suggests attention has shifted decisively upward.
The $273 Million Short Liquidity Magnet
The immediate technical focus for bullish traders is a well-defined supply zone between $2,050 and $2,100. Data from CoinGlass reveals a critical concentration of short-liquidation levels in this band, with cumulative leveraged shorts worth roughly $273 million sitting near $2,030. In derivatives markets, such dense clusters often act as “magnet” levels. The mechanism is straightforward: as price approaches these levels, overleveraged short positions face mounting losses. If the price tags these levels in quick succession, it can trigger forced buybacks (liquidations) from traders whose positions are being closed by their exchanges. These forced buy orders can, in turn, fuel rapid upward volatility, creating a self-reinforcing squeeze.
- Accelerated Volatility: A move into the $2,050-$2,100 zone could trigger a short squeeze, rapidly propelling prices higher as liquidations feed buying pressure.
- Breakout Confirmation: A sustained breakout above this range, converting it to support, would provide a strong technical signal for a move toward the next significant resistance near $2,150 and beyond.
- Downside Risk: Conversely, if the price is rejected from this zone, the high leverage in the system could exacerbate a move downward, targeting the recent support near $1,900.
Analyst Perspectives on Key Support and Resistance
Crypto analyst Cyril-DeFi highlighted that ETH/USD is concurrently testing a long-term ascending trendline that has provided reliable support since the last market cycle. “Every time the price touched this support, it eventually led to a strong bounce,” Cyril-DeFi noted in a recent analysis shared on X. “Right now, the $1.9k–$2k area looks like a key level that could determine the next move.” This confluence of a major historical trendline with the current consolidation range adds a layer of significance to the current price action. Meanwhile, institutional data from firms like CoinShares shows cryptocurrency investment products saw inflows of $619 million last week, demonstrating sustained institutional interest that may provide a broader tailwind for major assets like Ether, even amid traditional market concerns over geopolitics and commodities.
Broader Market Context and Historical Precedents
The current setup in Ether’s derivatives market echoes patterns seen in previous cycles where extreme leverage preceded major trending moves. To understand the potential scale, it’s useful to compare key leverage metrics and subsequent volatility from similar historical periods. The table below contrasts the current environment with two notable prior events: the leverage buildup before the Q1 2024 rally and the period preceding the volatility spike in November 2025.
| Period | Estimated Leverage Ratio High | Derivatives Inflow (ETH) | Subsequent 30-Day Volatility |
|---|---|---|---|
| Current (March 2026) | 0.78 | 110,343 | To be determined |
| Q1 2024 Rally Precursor | 0.72 | ~95,000 | +42% |
| Nov 2025 Volatility Spike | 0.75 | ~85,000 | +38% |
This comparison shows the current leverage ratio has reached a new peak, suggesting the market may be positioning for an even more significant volatility event. Furthermore, the evolving landscape of real-world asset (RWA) tokenization on blockchain platforms like Ethereum adds a fundamental layer of demand. As RedStone co-founder recently stated, traditional banks are increasingly likely to run RWA operations on two primary blockchain rails, with Ethereum being a prime candidate, potentially locking in long-term value and utility for the network.
What Happens Next: Pathways for ETH Price
The immediate trajectory for Ether hinges on its ability to capture the overhead short liquidity. A successful breach and hold above $2,100 would invalidate the recent swing failure pattern and likely trigger a wave of follow-through buying, setting a course toward testing $2,150 and then the $2,500 region. Market participants will closely monitor funding rates across perpetual swap markets; persistently high positive funding would indicate excessive long-side euphoria and could precede a sharp correction. Scheduled events, such as key Ethereum core developer meetings or updates on upcoming network upgrades, also serve as potential catalysts that can shift market sentiment independent of technical factors.
Trader Sentiment and Exchange Activity
On-chain and exchange data reveals a split in sentiment. While the derivatives market shows extreme bullish positioning via leverage, spot exchange flows have been more balanced, suggesting not all market participants are convinced of an imminent breakout. Some large holders, often called “whales,” have been moving tokens to custodial services, which can signal preparation for staking or holding rather than immediate selling. This divergence between leveraged futures traders and spot holders is typical before large directional moves and underscores the heightened uncertainty in the current environment.
Conclusion
Ether’s firm hold above $2,000, coupled with a record-high leverage ratio and massive derivatives inflows, paints a picture of a market coiled for a significant move. The primary technical target is the $273 million short liquidity cluster between $2,050 and $2,100. A clean breakout above this zone could accelerate gains toward $2,500. However, the extreme leverage also represents a clear risk; a rejection from this resistance could trigger a violent deleveraging event back toward the $1,900 support. Traders should watch for a confirmed break of the $2,100 level with volume, while remaining acutely aware that in conditions of peak leverage, volatility can explode in either direction. The coming days will test whether bullish traders can successfully engineer a short squeeze or if the overhead supply will once again dominate.
Frequently Asked Questions
Q1: What does ‘short liquidity’ mean in cryptocurrency trading?
Short liquidity refers to price levels where a large volume of leveraged short (betting on price decrease) positions are clustered. If the price rises to these levels, these shorts face liquidation, forcing exchanges to buy back the asset to close the positions, which can create rapid upward price movement known as a ‘short squeeze.’
Q2: Why is the $2,030-$2,100 range so important for Ether right now?
Data from CoinGlass shows approximately $273 million worth of leveraged short positions are set to be liquidated if Ether’s price reaches this zone. This concentration makes it a magnet for price action, as traders anticipate the buying pressure from forced liquidations.
Q3: What is the ‘estimated leverage ratio,’ and why is a record high significant?
The estimated leverage ratio, provided by CryptoQuant, measures the amount of open interest in derivatives markets relative to the reserves held on exchanges. A record high of 0.78 indicates traders are using exceptionally high levels of borrowed capital (leverage), which magnifies both potential profits and losses, leading to increased market volatility.
Q4: Could Ether realistically reach $2,500 soon?
A move to $2,500 would require a roughly 25% increase from the $2,000 level. For this to happen, ETH would need to decisively break through the $2,050-$2,100 short liquidity zone and establish it as support. While possible given the current setup, it is not guaranteed and depends on sustaining bullish momentum amid high leverage.
Q5: What are the biggest risks to this bullish scenario?
The primary risk is the high degree of leverage itself. If buying pressure fails at the key resistance zone, the subsequent sell-off could be amplified as overleveraged long positions are liquidated, potentially causing a sharp drop back to the $1,800-$1,900 support area.
Q6: How does traditional finance activity affect Ethereum’s price?
Institutional flows remain relevant. Recent data showing hundreds of millions in weekly inflows to crypto investment products suggests professional money is supporting the market. Furthermore, the growing narrative of banks using blockchains like Ethereum for real-world assets (RWAs) provides a long-term fundamental use case that can influence investor perception.