NEW YORK, March 21, 2026 — The US Dollar Index (DXY) has decisively broken above its daily 200-period moving average (200MA) in a significant technical move that is sending ripples of concern through global cryptocurrency markets. As of Friday morning trading, the index, which measures the dollar against a basket of six major currencies, tested its 200-period exponential moving average (200EMA) and now approaches the psychologically critical ~100 resistance level. This DXY break above the daily 200MA represents a potential regime shift in forex markets, applying immediate downward pressure on digital assets as traders recalibrate risk models for a stronger dollar environment. The move challenges the prevailing narrative of dollar weakness that has supported risk assets, including crypto, for much of the past quarter.
DXY Technical Breakout: Analyzing the Move
The US Dollar Index closed Thursday’s session at 99.87, firmly above its simple 200-day moving average of 99.42. During intraday trading on Friday, it pushed as high as 99.95, testing the 200EMA at 99.92. This dual breakthrough of key long-term trend indicators marks the first time the DXY has traded above both its 200MA and 200EMA since November 2025. Data from TradingView and Bloomberg terminals shows a 2.3% weekly gain for the index, its strongest five-day performance in fourteen weeks. The move correlates with shifting expectations for Federal Reserve policy, as recent inflation data has tempered market predictions for aggressive rate cuts. Consequently, the critical ~100 resistance level now acts as a focal point for both forex and crypto traders, a threshold that historically has triggered volatility across asset classes.
Historical context reveals the importance of the 100 level. The DXY last sustained a break above 100 in the third quarter of 2025, a period that coincided with a 22% correction in the total cryptocurrency market capitalization over eight weeks. Analysis by LMAX Group shows that since 2020, a DXY reading above 100 has corresponded with a negative monthly return for Bitcoin in 70% of instances. The current technical setup suggests traders are watching for a confirmed weekly close above the 200MA, which would signal a more durable trend change rather than a fleeting breakout.
Immediate Pressure on Cryptocurrency Markets
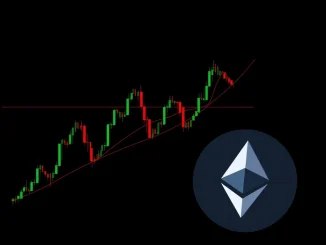
The strengthening dollar is applying acute pressure to cryptocurrency valuations. Bitcoin (BTC) fell 4.7% in the 24 hours following the DXY’s initial breach, dropping from $74,200 to a low of $70,650, according to data from CoinGecko. The broader crypto market correlation to dollar strength is intensifying. Ethereum (ETH) mirrored the decline, shedding 5.2%. Altcoins, typically more sensitive to macro shifts, experienced sharper drops, with the SOL/USD pair falling 7.1%. Market analysts point to two primary transmission channels. First, a stronger dollar increases the local-currency cost of Bitcoin for international buyers, potentially dampening demand. Second, it reinforces a ‘risk-off’ sentiment, prompting capital to flow out of speculative assets and into perceived safe havens, including the dollar itself.
- Liquidity Drain: Tighter dollar liquidity, implied by a rising DXY, reduces the capital available for leveraged speculation in crypto futures and perpetual swap markets.
- Institutional Rebalancing: Macro-focused funds and Commodity Trading Advisors (CTAs) often model trades based on dollar momentum, potentially triggering systematic selling of crypto exposures.
- Technical Domino Effect: The breakdown of key support levels in major cryptocurrencies, triggered by macro pressure, can activate cascading liquidations in over-leveraged derivatives markets.
Expert Analysis: A Macro Crossroads
Financial experts are framing this move as a critical test for digital assets. Dr. Elena Torres, Chief Macro Strategist at Digital Asset Research, stated in a client note this morning, “The DXY reclaiming its 200-day moving average is a significant macro development. Cryptocurrencies have enjoyed a tailwind from a weakening dollar narrative since late 2025. This breakout challenges that directly. The ~100 level is the line in the sand; a sustained break above it would likely force a prolonged period of consolidation or correction in crypto.” Her analysis aligns with data from the Chicago Mercantile Exchange (CME), which shows a sharp increase in open interest for dollar futures alongside a decline for Bitcoin futures. Separately, a report from Kaiko Research highlighted that Bitcoin’s 30-day correlation coefficient with the DXY has turned increasingly negative, reaching -0.48, its strongest inverse relationship in four months, meaning the assets are moving in opposite directions with greater consistency.
Historical Context and Comparative Analysis
This is not the first time crypto markets have faced a resurgent dollar. The current scenario bears similarities to the period between May and July 2024, when the DXY rallied from 100.50 to 107.40. During that earlier episode, Bitcoin corrected approximately 28% from its local high. However, the market structure today is fundamentally different. The introduction of U.S. spot Bitcoin ETFs has created a new, sizable pool of institutional demand that was absent in 2024. Furthermore, on-chain data from Glassnode indicates that the percentage of Bitcoin supply held by long-term holders is near all-time highs, suggesting a potentially more resilient investor base less prone to panic selling on macro headlines.
| Period | DXY High | Bitcoin Performance | Key Driver |
|---|---|---|---|
| May-Jul 2024 | 107.40 | -28% | Fed Hawkish Pivot, No ETFs |
| Sep-Oct 2025 | 101.20 | -15% | DXY Rally, ETF Inflows Slowed |
| Current (Mar 2026) | ~100.00 (Testing) | -4.7% (Initial) | DXY Breaks 200MA, ETF Flows Persistent |
What Happens Next: Scenarios for Traders
The immediate trajectory depends on whether the DXY can achieve a confirmed weekly close above the 200MA and subsequently challenge the 100 level. Market participants are monitoring several catalysts. The Federal Reserve’s next policy statement on April 2nd will be scrutinized for any language shift regarding the pace of its balance sheet runoff (Quantitative Tightening), which directly impacts dollar liquidity. Additionally, the U.S. Treasury’s quarterly refunding announcement next week will detail government debt issuance, influencing bond yields and, by extension, dollar attractiveness. For crypto, the key will be whether spot ETF flows, which saw a net inflow of $212 million on Thursday according to Farside Investors, can offset the macro headwind. A failure of the DXY at the 100 resistance could trigger a swift relief rally across digital assets.
Market Participant Reactions
Initial reactions from the crypto trading community have been cautious but not panicked. Derivatives data from Coinglass shows a moderate increase in put option buying for Bitcoin, targeting strikes at $68,000 and $65,000 for late April, indicating hedging activity. However, funding rates in perpetual swap markets remain slightly positive, suggesting leveraged longs have not yet been fully flushed out. On social trading platforms, sentiment analysis by Santiment shows a shift from ‘greed’ to ‘neutral’ over the past 48 hours. Notably, several large decentralized finance (DeFi) protocols reported an increase in stablecoin lending rates, a sign that traders are parking capital on the sidelines or preparing to meet potential margin calls.
Conclusion
The DXY break above the daily 200MA is a pivotal macro event demanding attention from every cryptocurrency investor. It signals a potential end to the dollar weakness that has buoyed risk assets and introduces a formidable headwind. While the immediate crypto market correlation has been negative, the market’s deeper institutionalization and strong long-term holder base provide a novel counterweight not present in previous cycles. The coming days will be defined by the battle at the critical ~100 resistance level for the dollar index. A rejection there could stabilize crypto prices, while a confirmed breakout would test the resilience of the digital asset market’s new structural foundations. Traders should prepare for elevated volatility and watch ETF flow data as a key indicator of institutional conviction amidst shifting macro tides.
Frequently Asked Questions
Q1: What does it mean that the DXY broke above its 200-day moving average?
It is a major technical signal suggesting a potential long-term trend reversal from dollar weakness to dollar strength. The 200-day moving average is widely watched by institutional traders as a bull/bear market divider. A break above it indicates buying pressure that could sustain a new uptrend.
Q2: Why does a stronger US Dollar hurt cryptocurrency prices?
A stronger dollar makes dollar-denominated assets like Bitcoin more expensive for international buyers using other currencies, potentially reducing demand. It also often reflects a ‘risk-off’ environment where investors sell volatile assets (like crypto) and seek safety in cash or government bonds.
Q3: What is the significance of the DXY 100 level for crypto traders?
The 100 level is a major psychological and technical resistance point. Historically, a DXY sustained above 100 has created a challenging environment for Bitcoin and other cryptocurrencies, often correlating with periods of consolidation or correction. It acts as a key line for assessing the severity of the macro headwind.
Q4: Could Bitcoin decouple from the dollar’s strength this time?
Possible, but historically difficult. While new factors like spot Bitcoin ETF inflows provide a unique source of demand, broad macro trends in the dollar still exert significant influence. Decoupling would require exceptionally strong, independent crypto-specific catalysts to outweigh the macro pressure.
Q5: How are professional traders responding to this DXY move?
Data shows they are increasing hedges through options (buying puts), monitoring ETF flows closely, and watching for a confirmed weekly close for the DXY above the 200MA. Many are reducing leverage and preparing for higher volatility rather than making directional bets immediately.
Q6: What should a typical crypto investor watch over the next week?
Watch for the DXY’s weekly close relative to 99.42 (the 200MA), daily net flows into U.S. spot Bitcoin ETFs, and key support levels for Bitcoin (e.g., $70,000 and $68,000). The Federal Reserve’s commentary on April 2nd will also be critical for the dollar’s next major move.