Chainlink Price Analysis: Navigating the Critical $12-$16 Range Amidst Market Uncertainty
As of January 2026, Chainlink’s native token LINK finds itself at a critical technical juncture, trading within a narrow $12 to $16 range that has captured the attention of cryptocurrency traders and analysts worldwide. This consolidation phase represents a significant moment for the decentralized oracle network, with market participants closely monitoring key price levels that could determine the asset’s near-term trajectory. The current price action reflects broader market indecision, particularly among altcoins, as traders await clearer directional signals from both technical patterns and fundamental developments within the blockchain ecosystem.
Chainlink’s Technical Conundrum: Support and Resistance Dynamics
Chainlink has established well-defined technical boundaries that have contained its price movement for several trading sessions. The $12 level functions as crucial support, representing a zone where buying interest has historically emerged to prevent further declines. Conversely, the $16 mark acts as formidable resistance, where selling pressure has consistently halted upward momentum. This compression creates what technical analysts describe as a “coiling” pattern, often preceding significant price movements once either boundary breaks.
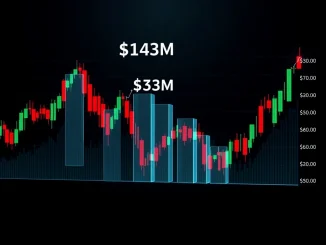
Market data from major cryptocurrency exchanges shows decreasing volume during this consolidation period, a typical characteristic of indecisive markets. The daily and weekly candlestick patterns reveal small bodies with varying wicks, indicating neither buyers nor sellers have gained decisive control. This equilibrium reflects the cautious sentiment prevailing across cryptocurrency markets, where traders are weighing multiple factors including Bitcoin’s influence, macroeconomic conditions, and Chainlink’s own network developments.
Market Context: Why Chainlink Faces This Indecision
Several interconnected factors contribute to Chainlink’s current technical predicament. Firstly, Bitcoin’s dominance continues to exert substantial influence over altcoin markets. When Bitcoin experiences sideways movement or uncertainty, capital typically flows away from riskier altcoins like LINK, leading to compressed trading ranges. Secondly, the broader cryptocurrency market has entered a phase of reassessment following regulatory developments and institutional adoption milestones.
Chainlink’s fundamental position as a leading decentralized oracle provider adds another layer to this analysis. The network continues to secure billions in value across multiple blockchain ecosystems, with recent integrations expanding its utility. However, the market appears to be pricing in both the network’s growth potential and competitive pressures from emerging oracle solutions. This fundamental-technical interplay creates the current equilibrium where neither bullish nor bearish narratives have gained clear dominance.
Historical Precedents and Pattern Recognition
Experienced traders recognize that consolidation phases like Chainlink’s current situation often resolve in significant directional moves. Historical analysis of LINK’s price action reveals similar compression periods throughout 2024 and early 2025, each culminating in moves exceeding 30% once range boundaries broke. The duration of the current consolidation, now approaching multiple weeks, suggests accumulating energy for a potentially substantial move.
Technical indicators provide mixed signals during such phases. Moving averages tend to converge, volatility measures like Bollinger Bands contract significantly, and momentum oscillators hover near neutral levels. This convergence of indicators toward equilibrium points represents the market’s collective uncertainty, requiring external catalysts or significant volume increases to establish a new trend direction.
Potential Scenarios for Chainlink’s Next Move
Market analysts outline two primary scenarios for Chainlink’s price resolution, each with distinct implications for traders and investors. The bullish scenario requires a confirmed daily close above $16 resistance with accompanying volume expansion. Such a breakout could trigger algorithmic buying and renewed investor interest, potentially propelling LINK toward the $18-20 range as the next resistance zones.
Conversely, the bearish scenario involves a breakdown below the $12 support level. This would indicate weakening buyer defense and could accelerate selling pressure, with potential targets at $10 and possibly $8 if broader market conditions deteriorate. Between these extremes exists the continuation scenario where range-bound trading persists, requiring different strategic approaches from market participants.
Key Technical Levels to Monitor:
- Immediate Resistance: $16.00 (range high)
- Primary Support: $12.00 (range low)
- Secondary Resistance: $18.50 (previous swing high)
- Secondary Support: $10.00 (psychological level)
- Volume Threshold: 50% above 30-day average for breakout confirmation
Trading Strategies for Range-Bound Markets
Professional traders emphasize specific approaches when dealing with assets in consolidation phases like Chainlink’s current situation. Range trading strategies become particularly relevant, involving buying near support levels and selling near resistance, with tight risk management parameters. However, these strategies require discipline and quick execution, as false breakouts remain common during compression periods.
Alternative approaches include waiting for confirmed breakouts before establishing positions, accepting slightly reduced profit potential in exchange for increased probability of success. Position sizing becomes crucial in uncertain markets, with experienced traders typically reducing exposure until clearer trends emerge. Risk management techniques including stop-loss placement, position diversification, and portfolio correlation analysis gain heightened importance during such technical standoffs.
The Institutional Perspective on Chainlink’s Position
Institutional analysis of Chainlink incorporates both technical and fundamental factors. From a network perspective, Chainlink continues expanding its oracle services across DeFi, insurance, gaming, and other blockchain sectors. The protocol’s cross-chain interoperability capabilities through CCIP (Cross-Chain Interoperability Protocol) represent significant technological advancement. However, market pricing appears disconnected from these fundamentals during consolidation phases, creating potential dislocations that sophisticated investors monitor for entry opportunities.
The failed ETF launch referenced in source materials represents one factor in Chainlink’s current valuation, though its direct market impact appears limited compared to broader cryptocurrency sentiment and Bitcoin correlation. Regulatory developments, particularly regarding oracle services and data provision in decentralized finance, represent another consideration for long-term investors evaluating Chainlink’s prospects beyond immediate technical patterns.
Comparative Analysis: Chainlink Versus Other Major Altcoins
Chainlink’s current technical position reflects broader patterns across major altcoins. Many Ethereum-based tokens and decentralized infrastructure projects show similar compression characteristics, suggesting sector-wide indecision rather than Chainlink-specific factors. However, LINK’s oracle specialization creates unique fundamental drivers that may influence its breakout direction differently from general-purpose smart contract platforms or application-specific tokens.
| Asset | Consolidation Range | Duration | Volume Trend |
|---|---|---|---|
| Chainlink (LINK) | $12-$16 | 3+ weeks | Declining |
| Polygon (MATIC) | $0.65-$0.85 | 2 weeks | Stable |
| Polkadot (DOT) | $6.50-$8.00 | 4 weeks | Declining |
| Avalanche (AVAX) | $32-$38 | 2.5 weeks | Increasing |
This comparative view suggests that while individual assets face unique technical circumstances, the broader altcoin market exhibits coordinated behavior. This coordination typically resolves when Bitcoin establishes clearer direction or when sector-specific catalysts emerge for particular projects or technological categories.
Conclusion
Chainlink’s price action between $12 support and $16 resistance represents a critical technical moment for the cryptocurrency. The current consolidation phase reflects broader market uncertainty while setting the stage for potentially significant directional movement. Traders and investors should monitor volume patterns, Bitcoin correlation, and fundamental developments within the Chainlink ecosystem for clues about the eventual breakout direction. Regardless of outcome, disciplined risk management and strategic patience remain essential when navigating such technically ambiguous environments. The resolution of this range will likely provide important signals not only for Chainlink but for oracle-dependent sectors across the broader blockchain ecosystem.
FAQs
Q1: What are the key support and resistance levels for Chainlink?
The primary support level sits at $12, while major resistance exists at $16. Secondary levels include $10 support and $18.50 resistance based on previous price action.
Q2: How long has Chainlink been trading in this range?
Chainlink has consolidated between approximately $12 and $16 for over three weeks as of January 2026, with decreasing volume indicating market indecision.
Q3: What typically happens after such consolidation periods?
Extended consolidation often precedes significant directional moves. Historical patterns suggest breakouts from similar ranges have resulted in moves exceeding 30% in previous instances.
Q4: How does Bitcoin’s price affect Chainlink during consolidation?
Bitcoin dominance strongly influences altcoin markets. Sideways Bitcoin movement often correlates with altcoin consolidation, while decisive Bitcoin trends typically pull altcoins in the same direction.
Q5: What trading strategies work best in range-bound markets?
Range trading (buying support, selling resistance) with tight stops works during confirmed consolidation, while breakout strategies (waiting for confirmation beyond boundaries) suit more conservative approaches. Position sizing and risk management remain crucial.
Related News
- Strategy’s Staggering 568,840 BTC Holdings: Michael Saylor Signals More Bold Bitcoin Buys
- Bitcoin Price News Feb 2026: Market Tests $66K Support as AI Token DeepSnitch and Altcoins Solana, Mantra Rally
- OKX Delisting: Crucial Update on AI16Z/USDT Perpetual Futures
Related: Coinbase USDC Yield Paid in Bitcoin: A Game-Changing Reward for Premium Users
Related: SBI Holdings Unveils Revolutionary ¥10B Onchain Bond with XRP Rewards for Retail Investors
Related: BNB Undervaluation: The Critical Technical Signals Every Investor Must See