March 15, 2026 — Bitcoin has posted its strongest weekly gain since September 2025, significantly outperforming traditional stock indices despite escalating geopolitical tensions. The cryptocurrency’s rally coincides with MicroStrategy raising approximately $776 million through its STRC instrument, creating potential buying power for over 11,000 BTC at current prices.
Divergence From Traditional Markets
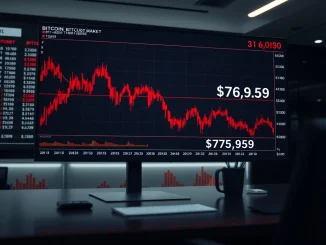
Bitcoin’s price increased more than 7% over the past week to approximately $70,625. During the same period, the S&P 500 index declined 1.60%. This divergence occurred against a backdrop of heightened Middle East tensions between the United States, Israel, and Iran that typically triggers risk-off sentiment in traditional markets.
Market data indicates U.S. spot Bitcoin ETFs attracted $767 million in net inflows across five consecutive trading days. These inflows demonstrate sustained institutional demand despite broader geopolitical uncertainty.
MicroStrategy’s STRC Mechanism
STRC.LIVE estimates suggest MicroStrategy may have raised sufficient capital through at-the-market sales of its STRC instrument to purchase substantial Bitcoin holdings. STRC is MicroStrategy’s exchange-traded income-paying instrument designed to convert investor demand into Bitcoin acquisition capital.
When STRC trades at or above its $100 par value, the company can issue additional shares. Proceeds from these sales become available for Bitcoin purchases. Last week, MicroStrategy acquired 17,994 BTC worth approximately $1.28 billion at that time, with about 30% funded by STRC sale proceeds.
Historical Geopolitical Patterns
Bitcoin has demonstrated resilience during previous geopolitical crises despite initial selloffs. Following Russia’s invasion of Ukraine in February 2022, Bitcoin initially declined but subsequently rallied approximately 40%.
A similar pattern emerged after Israel’s strikes on Iran in June 2025. Bitcoin dipped immediately following the conflict but gained about 25% over the following two months. During the January 2020 U.S.-Iran flare-up after General Qasem Soleimani’s killing, Bitcoin ultimately rose more than 50% despite an initial brief decline.
Technical Analysis Contradiction
Despite the bullish momentum, technical analysis reveals contradictory signals. Chart patterns show a bear flag formation on Bitcoin’s daily chart, which typically indicates potential downside risk after a strong downtrend.
Bear flags form when price rises inside an ascending, parallel channel following significant decline. These patterns usually resolve when price breaks below the channel’s lower boundary, potentially falling by the height of the preceding downtrend. Current analysis places a measured downside target near $51,000 if this pattern completes.
Bitcoin recently showed signs of upside exhaustion near the bear flag’s upper boundary, which aligns with the 50-day exponential moving average around $72,750. This creates potential for a bull trap where upward momentum reverses unexpectedly.
Market Context and Outlook
The simultaneous presence of strong fundamental buying pressure and concerning technical patterns creates market uncertainty. Some macro models suggest Bitcoin could escalate toward $100,000 in coming months based on historical patterns during geopolitical stress.
Market participants now watch whether institutional buying through instruments like STRC and spot ETFs can overcome technical resistance levels. The coming weeks will test whether Bitcoin maintains its divergence from traditional risk assets or succumbs to chart pattern pressures.
This analysis contains no investment advice or recommendations. All investment decisions involve risk, and readers should conduct independent research. While information comes from reliable sources, accuracy and completeness cannot be guaranteed. Forward-looking statements involve inherent uncertainties.
Updated insights and analysis added for better clarity.
This article was produced with AI assistance and reviewed by our editorial team for accuracy and quality.