

Bitcoin’s price stability around $67,000 is masking underlying weakness, according to market analysts. Data from major exchanges shows increased selling pressure from multiple investor classes, raising concerns about near-term support levels. This activity comes as technical indicators suggest a significant price move is imminent.
Bitcoin Price Stalls as Technical Signals Flash Warning
Bitcoin traded near $67,000 throughout the weekend of April 4-5, 2026, showing minimal movement. This sideways action followed a week of consolidation. Data from TradingView revealed a concerning pattern: volatility indicators had tightened significantly. The Bollinger Bands on four-hour charts constricted to their narrowest range in weeks. This pattern typically precedes a sharp price movement in either direction.
Also read: Nevada Judge Crushes Kalshi's Defense, Extends Ban on Event Contracts as Illegal Gambling
Market participants are watching this development closely. A pseudonymous trader known as LP analyzed the situation on social media platform X. “Looking back at previous cycles, bottoms were formed after multiple sweeps of the lows,” LP wrote. The trader noted that the current market cycle has behaved differently, consistently testing highs instead of lows. This leaves support levels largely untested and vulnerable.
Analyst Predicts Test of February Lows
LP’s analysis points to a specific price target. The trader suggested that a retest of February’s low below $60,000 is “likely just a matter of time.” This prediction stems from observed market structure. According to LP, liquidity has been building below current price levels, creating a gravitational pull for downward movement.
Also read: Crypto's Alarming Token Problem: Supply Flood Drowns Value Creation
“When that breakdown eventually happens, watch the behavior closely,” LP advised. “If price starts repeatedly sweeping the lows, making it psychologically difficult to enter longs, that’s when a true bottom is more likely forming.” This perspective suggests that a painful decline might be necessary to establish a sustainable foundation for the next upward move. Market watchers note this pattern has played out in previous Bitcoin cycles.
Order Book Data Reveals Unusual Selling Activity
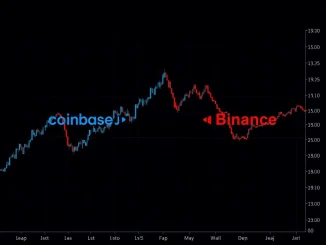
While price action appeared calm, behind-the-scenes data told a different story. Keith Alan, co-founder of trading resource Material Indicators, highlighted unusual activity on Binance’s order books. Alan posted a chart showing liquidity and volume categorized by investor class. The data revealed a bot using a time-weighted average price (TWAP) strategy to sell Bitcoin aggressively on Friday, April 3.
“The vertical orange line represents the smallest order class with a TWAP bot selling $18M in an hour,” Alan explained. He emphasized this volume was “exponentially more than their normal $3M-$5M daily volume in 1 hr. That ain’t retail!” This suggests sophisticated actors, not small investors, were driving the selling pressure. Alan added that larger whales appeared to be engaging in range-bound strategies, “buying dips and selling rips” as Bitcoin remained trapped.
Broader Market Context Adds Pressure
The cryptocurrency market faces headwinds beyond technical charts. Earlier in the week, Cointelegraph reported on resurgent U.S. dollar strength. The U.S. Dollar Index (DXY) has shown resilience, which historically creates pressure on dollar-denominated assets like Bitcoin. A stronger dollar makes Bitcoin more expensive for international buyers, potentially reducing demand.
Furthermore, traditional market correlations remain in play. Stock market performance, particularly in technology shares, often influences cryptocurrency sentiment. Any broader risk-off movement in financial markets could accelerate a Bitcoin decline. This interconnectedness means Bitcoin traders must monitor multiple asset classes.
Historical Precedents and Cycle Analysis
Understanding Bitcoin’s potential path requires examining its history. Previous bull and bear markets have followed recognizable, though not identical, patterns. The 2017 cycle saw a dramatic peak followed by a prolonged bear market that included multiple tests of major support levels. The 2021 cycle displayed similar characteristics, with significant volatility around key psychological price points.
Analysts compare current price action to these historical models. The absence of a deep retest following the 2024 all-time high is unusual. In past cycles, sharp corrections that shook out weak positions often preceded the most powerful rallies. This historical context informs many traders’ expectations for a deeper pullback. However, each cycle introduces new variables, including increased institutional adoption and regulatory developments.
What This Means for Investors and Traders
The current market setup presents clear risks and potential opportunities. For short-term traders, the tightening volatility suggests preparing for a breakout. Direction remains uncertain, making risk management essential. Setting stop-loss orders and defining clear entry and exit points can help address the expected increase in price swings.
Long-term investors face a different calculation. A drop below $60,000 could represent a buying opportunity if one believes in Bitcoin’s long-term thesis. Conversely, a break of key support could signal a deeper correction is underway. Diversification and position sizing become critical strategies in this environment. No single analysis guarantees market direction, but understanding the probabilities helps inform decisions.
Conclusion
Bitcoin’s price appears poised for significant movement as technical indicators compress and selling pressure emerges from key market participants. The consensus among several analysts points toward a test of lower support levels, potentially revisiting prices below $60,000. While the timing remains uncertain, market structure and on-chain data suggest such a move is increasingly probable. Investors should monitor order book activity, broader macroeconomic signals, and Bitcoin’s reaction to any breakdown for clues about the next major trend. The coming days will test whether current support can hold or if the market needs to seek a firmer foundation at lower levels.
FAQs
Q1: What are Bollinger Bands and why are they significant now?
Bollinger Bands are a volatility indicator that plots standard deviations above and below a moving average. When the bands constrict or “squeeze,” it signals that volatility has decreased to low levels and a period of high volatility often follows. The current tight squeeze on Bitcoin’s four-hour chart suggests a sharp price move is imminent.
Q2: What does “sweeping the lows” mean in trading?
“Sweeping the lows” refers to a price move that briefly pushes below a recognized support level, triggering stop-loss orders and liquidations, before potentially reversing. It’s a way for the market to collect liquidity that has built up below a price point. Trader LP argues this process is necessary to form a durable market bottom.
Q3: Who is selling Bitcoin according to the order book data?
Data analyzed by Keith Alan shows unusual selling activity from what appears to be sophisticated, algorithmic traders, not retail investors. A specific order class used a TWAP bot to sell $18 million worth of Bitcoin in one hour, far exceeding its typical daily volume. This indicates institutional or professional traders are distributing coins.
Q4: How does U.S. dollar strength affect Bitcoin’s price?
Bitcoin is primarily traded against the U.S. dollar. When the dollar strengthens, it takes more of other currencies to buy one dollar, making dollar-priced assets like Bitcoin more expensive for international buyers. This can reduce global demand and create downward price pressure.
Q5: Should investors be worried about a drop below $60,000?
Market corrections are a normal part of Bitcoin’s volatile history. A drop below $60,000 would represent a significant decline from recent levels but would not be historic. For long-term investors, such moves can present buying opportunities. The key is to assess whether such a drop changes the fundamental long-term outlook or simply represents a cyclical downturn.
This article was produced with AI assistance and reviewed by our editorial team for accuracy and quality.


Be the first to comment