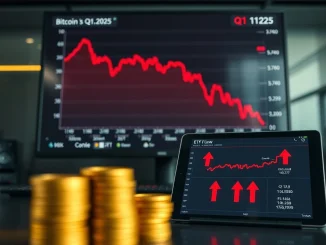
NEW YORK, March 9 — Cryptocurrency markets demonstrated remarkable resilience Monday as Bitcoin surged toward $69,500 despite a sharp rally in oil prices that typically pressures risk assets. This unexpected decoupling occurred as spot Bitcoin exchange-traded funds recorded their second consecutive week of net inflows, totaling $568.45 million according to SoSoValue data. Market analysts now scrutinize whether this movement signals a genuine trend reversal or what prominent on-chain analyst Willy Woo describes as a “bull trap” within an ongoing bear market from a long-range liquidity perspective. The simultaneous price action across major cryptocurrencies including Ethereum, Binance Coin, XRP, Solana, Dogecoin, Cardano, and Bitcoin Cash reveals critical technical levels that could determine short-term market direction.
Bitcoin Price Prediction: Analyzing the $69,000 Breakout Attempt
Bitcoin’s price action presents a compelling technical narrative. The cryptocurrency fell below the 20-day exponential moving average at $68,553 on Friday, yet bears failed to push prices below the crucial support line. This failure to capitalize on negative momentum suggests underlying demand at lower price levels. According to technical analysis principles, when markets refuse to make new lows amid bearish news, selling pressure often diminishes. Senior market analyst Ray Salmond notes this pattern frequently precedes consolidation phases before potential upward movements. The immediate resistance sits at $74,508, a level that, if breached, could signal a short-term bottom formation. Such a breakout might propel Bitcoin toward the $84,000 region where historical resistance awaits. Conversely, a breakdown below the current support line could trigger a retest of the vital $60,000 support zone, creating a 13% downside risk from current levels.
The broader context reveals significant institutional activity. Bitcoin ETF flows turned positive for two consecutive weeks for the first time in five months, according to institutional data provider Farside Investors. This shift coincides with increasing traditional market volatility, particularly in the S&P 500 Index, which closed below the 6,775 level Friday. The correlation breakdown between crypto and traditional risk indicators like oil prices marks a notable departure from 2024 market behavior, where energy shocks typically triggered across-the-board risk aversion.
Altcoin Price Forecasts: Critical Resistance Levels Across Major Cryptocurrencies
Large-cap altcoins mirror Bitcoin’s technical tension, trading near overhead resistance levels that will determine their near-term trajectories. Ethereum faces immediate resistance at its 20-day EMA of $2,018, with a successful break potentially leading to a test of the 50-day simple moving average at $2,249. Market depth data from CoinGlass indicates substantial liquidity clusters around these technical levels, suggesting institutional interest. Binance Coin shows similar characteristics, with the $670 resistance representing a make-or-break level that could open the path to $730 upon a decisive close above. Meanwhile, XRP continues its consolidation just below the $1.39 resistance, displaying what technical analysts describe as “constructive basing” behavior that often precedes significant moves.
- Solana’s Range-Bound Action: SOL has established a clear consolidation range between $76 and $95, with the flattish moving averages indicating equilibrium between buyers and sellers.
- Dogecoin’s Support Test: DOGE briefly fell below the $0.09 support Sunday before buyers quickly reclaimed the level, demonstrating active accumulation at perceived value zones.
- Cardano’s Channel Dynamics: ADA trades within a descending channel pattern, with the $0.25 support level proving crucial for maintaining the current technical structure.
- Bitcoin Cash’s Pattern Watch: BCH faces a critical test at $443, with a breakdown potentially completing a bearish head-and-shoulders pattern targeting $375.
Expert Perspectives: Diverging Views on Market Structure
Market analysts present contrasting interpretations of current conditions. On-chain analyst Willy Woo maintains a cautious stance, arguing in a detailed X post that “from a long-range liquidity perspective, Bitcoin remains solidly in the middle of a bear market and is currently forming a bull trap.” Woo’s analysis focuses on macro liquidity conditions rather than short-term price action. Conversely, independent analyst Rakesh Upadhyay emphasizes the technical significance of failed breakdowns, noting that “when markets ignore bearish catalysts, it often signals underlying strength that manifests later.” This analytical divergence reflects the complex interplay between macro conditions and technical patterns currently characterizing cryptocurrency markets. Bloomberg Intelligence senior macro strategist Mike McGlone recently noted in a research report that cryptocurrency correlations with traditional risk assets have become increasingly unstable during 2025, creating both opportunities and challenges for portfolio managers.
Traditional Market Correlations: SPX and DXY Technical Outlook
The S&P 500 Index’s technical deterioration presents a concerning backdrop for risk assets generally. The index completed a bearish moving average crossover Friday while the Relative Strength Index dipped into negative territory. These developments suggest increasing downward momentum that could test the 6,550 support level in coming sessions. Historically, sustained equity weakness eventually pressures cryptocurrency valuations, though the timing and magnitude of this relationship have shown significant variation since 2023. The US Dollar Index presents a different technical picture, trading near the 99.50 resistance with bullish momentum indicators. A decisive close above 100.54 would signal renewed dollar strength that typically creates headwinds for dollar-denominated assets like cryptocurrencies. The simultaneous pressure from equity weakness and potential dollar strength creates a challenging macro environment that makes cryptocurrency’s recent resilience particularly noteworthy.
| Asset | Key Resistance | Key Support | Technical Bias |
|---|---|---|---|
| Bitcoin (BTC) | $74,508 | $60,000 | Neutral-Bullish |
| Ethereum (ETH) | $2,249 (50-day SMA) | $1,750 | Neutral |
| S&P 500 Index | 6,775 | 6,550 | Bearish |
| US Dollar Index | 100.54 | 98.17 (20-day EMA) | Bullish |
Forward-Looking Analysis: Key Catalysts and Market Drivers
Several scheduled events and data releases could determine whether current technical levels hold or break. The Federal Reserve’s March policy meeting minutes release Wednesday will provide crucial insight into monetary policy trajectory, particularly regarding balance sheet normalization pace. Additionally, February Consumer Price Index data scheduled for Thursday could significantly impact inflation expectations and, consequently, risk asset valuations. Within cryptocurrency markets specifically, the continuation or reversal of Bitcoin ETF flows represents the most immediate fundamental catalyst. Historical patterns suggest that sustained institutional inflow typically precedes retail interest acceleration by approximately 4-6 weeks, creating a potential timing framework for evaluating current market structure. The upcoming Bitcoin halving event, while still months away, already influences long-term holder behavior according to Glassnode’s accumulation trend score, which shows increasing accumulation by entities holding 100-1,000 BTC.
Market Participant Reactions and Positioning Data
Derivatives markets reveal cautious optimism among sophisticated traders. Bitcoin futures open interest increased 8% during the recent price advance, according to Coinglass data, while funding rates remain neutral across major exchanges. This combination suggests measured positioning rather than speculative excess. Options markets tell a similar story, with the put-call ratio hovering near equilibrium at 0.67, indicating balanced hedging activity. Retail sentiment measured by the Crypto Fear & Greed Index stands at 54 (Neutral), a significant improvement from the 28 (Fear) reading observed three weeks ago but far from the extreme greed levels that typically precede corrections. This gradual sentiment improvement aligns with the technical picture of cautious accumulation rather than euphoric buying.
Conclusion
Cryptocurrency markets face a critical technical juncture as Bitcoin tests resistance near $69,500 despite headwinds from rising oil prices and equity market weakness. The simultaneous testing of overhead resistance across major altcoins suggests coordinated market behavior that often precedes significant directional moves. While analyst opinions diverge on whether current conditions represent a genuine bottom or a bear market rally, the technical evidence points to diminishing selling pressure at current levels. Traders should monitor the $74,508 Bitcoin resistance and corresponding altcoin levels for confirmation of sustained upward momentum, while maintaining awareness of traditional market correlations that could reassert themselves. The coming week’s economic data, particularly inflation metrics and Fed communications, will likely determine whether cryptocurrencies can maintain their recent decoupling from traditional risk assets or revert to established correlation patterns.
Frequently Asked Questions
Q1: Why did Bitcoin rise despite increasing oil prices?
Bitcoin’s price increase amid rising oil prices represents a breakdown in the typical correlation between energy shocks and risk asset weakness. This decoupling suggests cryptocurrency-specific factors, particularly Bitcoin ETF inflows totaling $568.45 million over two weeks, are currently outweighing traditional macro concerns.
Q2: What is the most important resistance level for Bitcoin currently?
The $74,508 level represents the most significant immediate resistance for Bitcoin. A decisive close above this level would suggest the cryptocurrency has established a short-term bottom and could advance toward the $84,000 region based on technical pattern measurements.
Q3: How are altcoins performing relative to Bitcoin in this move?
Major altcoins including Ethereum, Binance Coin, and XRP are testing their respective overhead resistance levels simultaneously with Bitcoin’s advance. This coordinated testing suggests broad market participation rather than isolated Bitcoin strength, though breakout timing may vary across assets.
Q4: What does Willy Woo mean by “bull trap” in current market conditions?
On-chain analyst Willy Woo uses “bull trap” to describe a situation where prices rally enough to convince traders a bear market has ended, only to reverse and make new lows. His analysis focuses on long-range liquidity metrics rather than short-term price action.
Q5: How might traditional market movements affect cryptocurrencies this week?
The S&P 500’s bearish technical structure and potential US Dollar Index strength create traditional market headwinds. However, the recent correlation breakdown suggests cryptocurrencies may continue decoupling, particularly if Bitcoin ETF inflows persist or accelerate.
Q6: What should traders watch for in coming sessions?
Traders should monitor Bitcoin’s ability to hold above $68,553 (20-day EMA) and attempt a break above $74,508. Simultaneously, watch for continuation or reversal of ETF flows, Thursday’s CPI data release, and whether altcoins can break their respective resistance levels to confirm broad market strength.