Global, March 2025: A prominent market analyst has issued a stark Bitcoin price prediction, warning that the cryptocurrency could potentially decline to a range between $44,000 and $35,000 by 2026. This forecast follows Bitcoin’s breach of a critical long-term trendline support level, an event that has historically preceded significant market corrections. The warning comes amidst a period of intense volatility, with nearly $1.1 billion in long and short positions liquidated across major exchanges over just three days, highlighting the fierce battle between bullish and bearish forces. This analysis provides a detailed examination of the technical factors, market mechanics, and historical context behind this sobering outlook.
Bitcoin Price Prediction: Analyzing the Broken Trendline Support
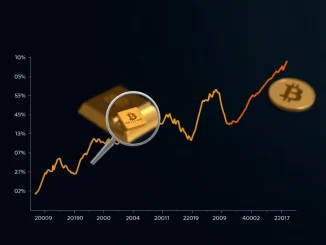
The cornerstone of the analyst’s bearish Bitcoin price prediction is the confirmed break below a multi-year ascending trendline. This trendline, drawn from major cyclical lows, had acted as a foundational support level for Bitcoin’s broader bull market structure. A decisive weekly or monthly close below this level is considered by many technical analysts as a significant shift in market structure from bullish to neutral or bearish. The loss of this support opens the door for a deeper retracement to test the next major zones of liquidity and investor interest. Historical precedent shows that when Bitcoin loses such macro support, it often seeks validation at lower price discovery levels, which can take months to establish. This process involves shaking out over-leveraged positions and reassessing the asset’s fair value based on evolving macroeconomic conditions and on-chain metrics.
Understanding the $1.1 Billion Liquidation Event
The recent market turbulence, resulting in approximately $1.1 billion in liquidations, is not merely a statistic but a reflection of underlying market stress. Liquidations occur when an exchange forcibly closes a trader’s leveraged position due to a partial or total loss of the trader’s initial margin. This cascade of forced selling (or buying, in the case of short squeezes) can exacerbate price movements in both directions.
- Bull vs. Bear Pressure: The fact that liquidations were nearly equal between long and short positions indicates a market in equilibrium of fear and greed, with neither side establishing clear dominance. This often leads to choppy, directionless price action.
- Volatility Indicator: Such a high volume of liquidations in a short period is a classic sign of elevated volatility. It signals that price swings are large enough to trigger stop-losses on a massive scale, creating a self-reinforcing cycle of volatility.
- Market Health Check: While painful for traders, these events help to flush out excessive leverage from the system, potentially creating a healthier foundation for the next sustainable move, whether up or down.
The Mechanics of Key Liquidity Zones
The analyst identified two critical liquidity zones currently guiding Bitcoin’s short-term trajectory: $61,000–$64,000 and $66,000–$69,000. In modern market theory, price tends to gravitate toward areas of high liquidity, where a large volume of open buy and sell orders resides. The $61K-$64K zone is now acting as a potential resistance area—a region where previous buyers may look to exit breakeven positions, and new sellers may emerge. Conversely, a reclaim of the $66K-$69K zone could signal a failure of the bearish breakdown and a potential trap for short sellers. These zones act as magnets for price action, and their interaction will be crucial in determining whether Bitcoin stabilizes or continues its descent toward the analyst’s long-term $44K-$35K target range. Monitoring order book depth and volume profile in these areas provides real-time insight into market sentiment.
Historical Context for a 2026 Bitcoin Forecast
Placing a 2026 price target requires an understanding of Bitcoin’s historical cycles. The cryptocurrency has experienced periods of parabolic growth followed by prolonged consolidations or drawdowns that often retrace a significant portion of the previous bull run. A drop to the $35,000-$44,000 range in 2026 would represent a deep correction within the context of a potential multi-cycle bull market, but not an unprecedented one. For instance, the 2017 bull market peak near $20,000 was followed by a bear market low around $3,200—an 84% drawdown. The subsequent run to $69,000 in 2021 saw a major correction to nearly $29,000—a 58% drop from its high. A move to $35,000 from an assumed future high would need to be evaluated against the scale of that preceding rally. The 2026 timeline also aligns with the post-Bitcoin halving cycle theory, which suggests a period of distribution or correction often follows the initial euphoric phase after the block reward reduction.
Implications for Investors and the Crypto Ecosystem
A sustained period of lower prices, as predicted by this Bitcoin price prediction, would have wide-ranging implications. For long-term holders (“HODLers”), it could present a strategic accumulation opportunity, echoing the philosophy of buying during periods of fear. For the broader cryptocurrency ecosystem, reduced Bitcoin dominance or a sideways-trending flagship asset could shift investor attention and capital toward altcoins and decentralized finance (DeFi) projects. However, a deep and prolonged Bitcoin correction could also dampen overall market sentiment, reduce venture capital inflows, and slow the pace of institutional adoption. Miners would face pressure as revenue declines, potentially leading to industry consolidation. Ultimately, such a phase could separate projects with robust fundamentals and utility from those driven purely by speculation, leading to a healthier, more mature market in the long run.
Conclusion
The analyst’s Bitcoin price prediction for a potential decline to the $44,000-$35,000 range by 2026 is a sobering assessment based on technical breakdowns and current market mechanics. While predictions are inherently uncertain, the breach of long-term support and the violent liquidation events provide a factual basis for caution. Investors should prioritize risk management, diversify their portfolios, and base decisions on a combination of technical analysis, on-chain data, and macroeconomic factors rather than any single forecast. The coming months will be critical in observing whether Bitcoin can reclaim its lost support or if it will embark on the deeper corrective path outlined in this analysis. Regardless of the short-term direction, volatility remains the only certainty.
FAQs
Q1: What is the main reason behind the prediction that Bitcoin could drop to $44K-$35K?
The primary reason cited is Bitcoin’s decisive break below a major long-term ascending trendline that had supported its bull market for years. This technical breakdown is viewed as a significant shift in market structure.
Q2: What do the $1.1 billion in liquidations mean?
This indicates extreme market volatility where large numbers of leveraged long and short positions were forcibly closed by exchanges due to rapid price moves. It shows equal pressure from bulls and bears and a market flushing out excess leverage.
Q3: What are liquidity zones, and why are $61K-$64K and $66K-$69K important?
Liquidity zones are price ranges where a high concentration of buy and sell orders exists. These specific zones are now key battlegrounds that will determine Bitcoin’s short-term direction, acting as either resistance or support.
Q4: Has Bitcoin experienced similar deep corrections in the past?
Yes. Following its 2017 peak, Bitcoin fell over 80%. After its 2021 high, it corrected by nearly 58%. Deep drawdowns within its long-term uptrend are a historical characteristic of its market cycles.
Q5: Should investors sell their Bitcoin based on this prediction?
This is a single analyst’s forecast. Investment decisions should not be based on one prediction but on individual risk tolerance, investment horizon, and a comprehensive analysis of multiple data points, including personal financial goals.
Updated insights and analysis added for better clarity.
This article was produced with AI assistance and reviewed by our editorial team for accuracy and quality.