NEW YORK, March 19, 2026 — Bitcoin’s price action triggered significant market movements today as analysis from multiple trading platforms indicates another potential dip following a liquidity sweep above $72,000. The leading cryptocurrency reached $71,000 during Tuesday’s trading session, liquidating approximately $186 million in short positions within 24 hours. Market structure analysis reveals thin liquidity clusters above current levels and heavier concentrations below $70,000, setting the stage for potential downward pressure. This development comes amid rising spot trading volume and continued institutional demand through Bitcoin exchange-traded funds, creating a complex market dynamic that traders are closely monitoring.
Bitcoin Liquidity Analysis Points to Potential Correction
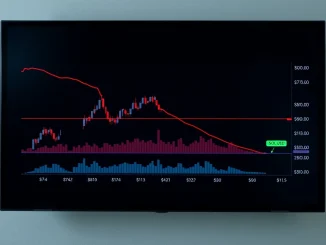
Data from TradingView and CoinGlass shows BTC/USD trading around $70,780 on Bitstamp at press time, representing a 4.5% increase over the previous 24 hours. The price recovery occurred while liquidating substantial short positions, creating what analysts describe as a “liquidity vacuum” above current levels. According to market structure experts, orders are stacking both above and below the spot price, with the $70,000-$72,000 supply zone showing particularly thin liquidity that could be easily swept. This technical setup suggests the market may test higher levels before encountering significant resistance.
Market participants are watching the $74,000-$75,000 zone closely, as CoinGlass data identifies this as the “largest short liquidation cluster” on weekly time frames. However, the more immediate concern comes from substantial liquidity clusters between $64,000 and $68,000, which contain approximately four times more liquidity than the zones above current price. This imbalance creates what analysts call a “gravitational pull” toward lower levels once the $72,000 pocket gets filled. The market structure resembles patterns seen during previous consolidation phases before significant directional moves.
Technical Indicators Show Mixed Signals Amid Recovery
Bitcoin’s momentum indicators present a complex picture as the market navigates conflicting signals. The 14-day relative strength index (RSI) has risen from 30 on March 1 to 52 as of Tuesday, according to Glassnode’s latest Weekly Market Pulse report. This improvement signals modest momentum recovery and suggests increasing buyer activity. Meanwhile, spot trading volume has surged to $9.3 billion from $3.38 billion just three days earlier, representing a more than 140% increase that indicates returning retail and institutional interest.
- RSI Recovery: The RSI’s climb from oversold territory suggests improving technical conditions
- Volume Surge: Spot volume increase demonstrates renewed market participation
- Liquidity Distribution: Order book analysis reveals concentration below current levels
- ETF Activity: Institutional products show sustained demand despite market volatility
Institutional Perspective on Bitcoin Market Structure
Glassnode analysts note that the rising RSI “points to high buyer activity” while emphasizing that spot Bitcoin ETF activity remains “a relative area of strength.” The analytics firm reports net ETF inflows accelerating to $934 million, with trading volumes rising to $23.1 billion from $16 billion last week. “The strength of inflows points to sustained institutional demand and continued traditional finance engagement,” Glassnode stated in their official analysis. This institutional participation creates a fundamental support layer beneath technical price levels.
Comparative Analysis: Bitcoin ETFs vs. Traditional Assets
The current market dynamics highlight Bitcoin’s evolving role within broader financial markets. While Bitcoin ETFs recorded net positive inflows over the past 30 days, gold ETFs experienced record outflows during the same period. This divergence suggests potential capital rotation from traditional safe-haven assets into digital alternatives. The pattern mirrors institutional behavior observed during previous market transitions, where new asset classes gradually absorb capital from established ones.
| Asset Class | 30-Day ETF Flows | Trading Volume Change |
|---|---|---|
| Bitcoin ETFs | +$934 million | +44% weekly increase |
| Gold ETFs | Record outflows | Declining trend |
| Equity ETFs | Mixed performance | Moderate increase |
Forward-Looking Market Scenarios and Trader Positioning
Market participants are preparing for several potential scenarios based on current technical setups. The most immediate focus remains the $72,000 liquidity zone, which could trigger either continuation or reversal patterns depending on how orders interact at that level. Analysts at CryptoReviewing noted in their Tuesday market update that “bulls just applied the pressure” but cautioned that the substantial liquidity below creates a “more likely” zone for price discovery in the near term. This balanced perspective reflects the market’s current uncertainty.
Trader Sentiment and Exchange Activity Patterns
Crypto investor and analyst CW8900 observed that “net buying” was occurring across all major exchanges, describing this as a “positive signal of actual buying demand.” This on-chain activity contrasts with some of the more cautious technical readings, creating what market participants call a “divergence between price action and network fundamentals.” Exchange data shows balanced order flow with slightly higher buying pressure on spot markets, while derivatives markets show increased hedging activity as traders prepare for potential volatility.
Conclusion
Bitcoin’s market structure suggests a complex period ahead as technical analysis points toward potential downward pressure following the $72,000 liquidity sweep. The conflicting signals between improving momentum indicators and concerning liquidity distribution create what analysts describe as a “high-conviction, low-certainty” environment. Institutional participation through ETF channels provides fundamental support, while technical patterns suggest testing of lower liquidity clusters. Market participants should monitor the $70,000 level closely, as sustained breaks below could trigger moves toward the $64,000-$68,000 zone where substantial liquidity awaits. The coming sessions will reveal whether improving fundamentals can overcome technical headwinds in this evolving Bitcoin price analysis scenario.
Frequently Asked Questions
Q1: What does a liquidity sweep mean in Bitcoin trading?
A liquidity sweep occurs when price moves rapidly through an area where many stop-loss orders or limit orders are concentrated, effectively “sweeping” that liquidity from the market. In this case, the $72,000 level contained thin liquidity that could be easily triggered.
Q2: How significant are the $186 million in liquidated short positions?
While substantial, this represents a moderate liquidation event compared to previous market moves. The more significant factor is the market structure it revealed, showing where future liquidity concentrations exist.
Q3: What role do Bitcoin ETFs play in current market dynamics?
Bitcoin ETFs provide consistent institutional demand, with $934 million in net inflows recently. This creates a fundamental support layer that can cushion against purely technical downward moves.
Q4: How reliable are liquidation heatmaps for predicting price movements?
Liquidation heatmaps show where orders are concentrated but don’t guarantee price will reach those levels. They indicate zones of potential interest where price might gravitate if other conditions align.
Q5: What should traders watch for in the coming days?
Key levels include holding above $70,000 for bullish continuation or breaking below for bearish scenarios. Also watch ETF flow data and spot volume patterns for confirmation of institutional or retail sentiment shifts.
Q6: How does this analysis affect long-term Bitcoin investors?
Long-term investors typically look beyond short-term liquidity events. The improving fundamentals, including ETF inflows and network activity, may matter more than technical price levels for investment horizons exceeding six months.