

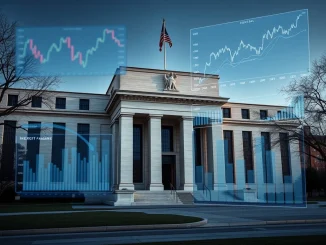
Bitcoin’s price action is flashing a potentially significant technical signal not seen in nearly a year. As of the weekly close on April 6, 2026, BTC reclaimed key levels above $70,000, setting the stage for a volatile week shaped by a major technical indicator, escalating geopolitical tensions, and essential U.S. inflation data.
A Key Technical Indicator Turns Bullish
On longer time frames, Bitcoin’s weekly chart is generating optimism. The weekly closing price settled back above the 200-week exponential moving average, a level watched closely by analysts. More notably, the Moving Average Convergence Divergence (MACD) indicator on the weekly chart is hinting at a bullish crossover.
Also read: Prediction Markets Surge as Vital Real-Time Macro Radar for Crypto Traders Amid Iran Tensions
This matters because the last time this specific signal appeared was in May 2025. Following that signal, Bitcoin’s price rallied from approximately $94,000 to $119,000 over two months. Data from TradingView shows the current setup mirrors that previous pattern.
Analysis shared on social media platform X highlights the historical context. Trading resource GalaxyTrading compared current MACD behavior to past cycles. “In the 2018 bear market, it took around 245 days for the weekly MACD to turn positive,” the analysis noted. “In 2022, it also took 245 days to turn bullish. In 2026, we will reach 245 days by the end of April.” This suggests the current market structure is following a familiar, though not guaranteed, timeline for recovery.
Also read: China's Blockchain Banking Push: Tax Authority Demands Tech Overhaul for Lending
Price Action and Market Liquidation
Bitcoin managed to push past $70,000 following the weekly close, reaching new highs for April. This move triggered substantial market activity. According to data from CoinGlass, total cryptocurrency liquidations exceeded $250 million in the 24 hours leading up to the morning of April 6.
The price surge caught many short positions off guard. However, some traders remain cautious. Analyst CrypNuevo pointed to potential liquidity pools around $64,000 that could attract price movement downward. “There are some HTF liquidations between $64k-$64.5k. This adds fuel a move lower,” he commented.
On-chain analytics firm CryptoQuant observed a shift in trader behavior. In a blog post, contributor Amr Taha noted the return of “aggressive short-term positioning,” evidenced by spikes in net taker volume and open interest on major exchanges like Binance. This implies the recent price increase is being supported not just by spot buying, but also by renewed speculation in derivatives markets.
Expert Perspective on Market Structure
Despite the bullish signal, a cloud of caution hangs over the market. Keith Alan, co-founder of Material Indicators, warned that Bitcoin’s price action is still trading within what he identifies as a bear flag pattern. The first such pattern in January 2026 preceded a drop of roughly $25,000. “Structurally, $BTC price action is still nearly identical to the prior bear flag structure,” Alan stated. He advises watching for a clear deviation from this path before assuming a sustained uptrend.
Other traders echo this wariness. Pseudonymous analyst LP suggested that a retest of February’s low below $60,000 is probable. “When that breakdown eventually happens, watch the behavior closely,” LP advised. The implication is that a true market bottom often forms only after repeated tests of support, shaking out weak hands.
Geopolitical Tensions Reach a Deadline
Macroeconomic forces are set to inject extreme volatility this week. The ongoing conflict involving the U.S., Israel, and Iran continues to dictate broader market sentiment. Oil prices reflect this uncertainty, with West Texas Intermediate crude surpassing $115 per barrel.
All eyes are on a specific deadline: 8 PM Eastern Time on Tuesday, April 7. This is when U.S. President Donald Trump has promised major infrastructure strikes if no deal with Iran is reached. Over the weekend, Trump posted on Truth Social, referring to the day as “Power Plant Day” and “Bridge Day” while demanding the reopening of the Strait of Hormuz.
However, conflicting reports of a potential 45-day ceasefire have emerged. Trading resource The Kobeissi Letter described it as a “‘last-ditch effort’ to prevent ‘massive strikes on Iranian civilian infrastructure.'” The report noted that S&P 500 futures erased losses on this news, highlighting how sensitive risk assets are to war-related headlines. Bitcoin, as a risk-on asset, remains exposed to these triggers.
Inflation Data Adds Another Layer of Risk
Markets must also digest critical U.S. inflation data this week. The releases include the Personal Consumption Expenditures (PCE) Index, the Federal Reserve’s preferred inflation gauge, and the Consumer Price Index (CPI).
Previous prints from February did not account for the recent surge in oil prices. The spike above $115 per barrel directly impacts inflation calculations. The Kobeissi Letter provided analysis on this effect: “Oil prices are now crossing above $115/barrel in the US. As a result, our models indicate that if current levels are sustained another ~7 weeks, US CPI inflation will rise to ~3.7%.” This is notably higher than the Federal Reserve’s 2% target.
Data from CME Group’s FedWatch Tool shows markets currently assign almost no probability to an interest rate change at the Fed’s late-April meeting. But sustained high inflation could alter that outlook for later in the year, affecting all financial markets.
Conclusion
Bitcoin enters a central week caught between opposing forces. A key technical indicator on the weekly chart suggests the potential for a significant bullish trend change, the first since 2025. Yet this signal conflicts with a persistent bear flag pattern that analysts fear could lead to lower prices. The Bitcoin price will likely be decided by which narrative gains strength: the technical buy signal or the macro headwinds of war and inflation. Traders face a high-stakes environment where a major geopolitical deadline and key economic data could override chart patterns in an instant.
FAQs
Q1: What is the MACD indicator and why is it important for Bitcoin?
The Moving Average Convergence Divergence (MACD) is a trend-following momentum indicator. A bullish crossover on a weekly chart, which Bitcoin is currently approaching, has historically signaled the start of major upward price moves. The last such crossover in May 2025 preceded a $25,000 rally.
Q2: What are the main risks to Bitcoin’s price this week?
The primary risks are macroeconomic. An escalation in the U.S.-Iran conflict past the April 7 deadline could spark a sell-off in risk assets. Additionally, hotter-than-expected U.S. inflation data (PCE and CPI) could reinforce a “higher for longer” interest rate stance from the Federal Reserve, which typically pressures speculative assets like Bitcoin.
Q3: What is a “bear flag” pattern and why are analysts concerned?
A bear flag is a technical chart pattern suggesting a continuation of a downtrend. It forms after a sharp decline (the flagpole), followed by a period of consolidation (the flag). Analysts are concerned because Bitcoin’s price action in early 2026 appears similar to a bear flag that formed in January, which was followed by a significant drop.
Q4: How does the price of oil affect Bitcoin?
Oil prices affect Bitcoin indirectly. A sharp rise in oil, as seen recently, fuels broader inflation. Persistent high inflation may force central banks to maintain restrictive monetary policy, including high interest rates. This environment reduces liquidity and investor appetite for high-risk, high-volatility assets like cryptocurrencies.
Q5: What happens if Bitcoin breaks below the bear flag support?
If Bitcoin’s price breaks and closes decisively below the support level of the current consolidation pattern, technical analysis suggests a “measured move” downward could follow. Some analysts, like Keith Alan of Material Indicators, have outlined a potential target in the mid-$40,000 range based on the pattern’s structure.
This article was produced with AI assistance and reviewed by our editorial team for accuracy and quality.

Be the first to comment