Mid-Cap Altcoins Reveal Crucial Accumulation Trends in February 2026 Market Snapshot
Global, February 17, 2026: Phoenix Group’s latest cryptocurrency market snapshot reveals significant accumulation patterns developing among mid-cap altcoins, suggesting potential shifts in investor sentiment and market structure as we approach the midpoint of the first quarter. The comprehensive report, released today, identifies specific assets entering what analysts term the “Accumulation Zone,” a technical condition that historically precedes notable price movements when confirmed by broader market factors.
Understanding the Accumulation Zone Concept in Cryptocurrency Markets
Market accumulation represents a period when informed investors systematically acquire assets, typically during price consolidation or downtrends, anticipating future appreciation. Phoenix Group’s methodology combines on-chain metrics, exchange flow data, and technical indicators to identify these patterns. The firm’s research team analyzes wallet movements, exchange reserves, and buying pressure across multiple timeframes to distinguish between routine trading activity and strategic accumulation.
Historical data from previous market cycles shows that accumulation phases often precede significant bullish movements. For instance, similar patterns emerged in late 2023 before the 2024 market expansion. However, analysts emphasize that accumulation alone doesn’t guarantee immediate price appreciation. Market conditions, macroeconomic factors, and project fundamentals must align to validate these technical signals. The current analysis focuses specifically on mid-capitalization assets, typically defined as cryptocurrencies ranked between 50 and 200 by market capitalization.
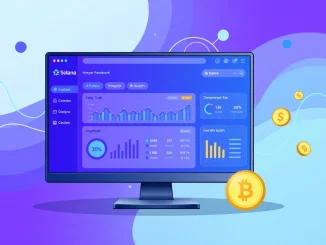
Phoenix Group’s February 2026 Market Snapshot Methodology
Phoenix Group employs a multi-factor approach to identify accumulation trends. Their February 17 snapshot incorporates data from the preceding 30-day period, with particular emphasis on the first half of February 2026. The analysis examines several key metrics that collectively suggest accumulation behavior:
- Exchange Net Position Change: Measures the net flow of assets to and from exchanges, with sustained outflows suggesting investors are moving assets to private wallets for holding
- Large Transaction Volume: Tracks transactions exceeding $100,000, with increased activity potentially indicating institutional or sophisticated investor participation
- Supply Distribution Shifts: Monitors changes in token distribution among different wallet size categories
- Technical Structure Analysis: Evaluates price action within defined support and resistance zones over multiple timeframes
The firm’s report emphasizes that these indicators must converge to suggest meaningful accumulation rather than routine market activity. Their analysis excludes assets with insufficient liquidity or those experiencing extraordinary events like major protocol upgrades or regulatory announcements during the observation period.
Mid-Cap Altcoins Showing Notable Accumulation Patterns
While Phoenix Group maintains confidentiality regarding specific asset recommendations in their public snapshot, their analysis identifies several categories of mid-cap altcoins exhibiting accumulation characteristics. These generally fall into three sectors: decentralized finance protocols, blockchain infrastructure projects, and specialized Web3 applications. The accumulation appears concentrated in assets that demonstrated strong fundamentals throughout 2025 but experienced price compression during the January 2026 market correction.
Industry observers note that mid-cap assets often attract accumulation during market transitions because they offer greater growth potential than large-cap cryptocurrencies while presenting less risk than micro-cap projects. This dynamic became particularly evident after the 2024-2025 market maturation, which saw increased institutional participation and more sophisticated investment strategies entering the cryptocurrency space. The current accumulation patterns suggest investors are positioning for the next phase of blockchain adoption rather than short-term trading opportunities.
Technical Analysis and Market Context for February 2026
The broader cryptocurrency market context provides essential background for interpreting these accumulation signals. February 2026 follows a period of relative stability after the volatility that characterized much of 2025. Bitcoin and Ethereum, the market leaders, have established consolidation patterns within defined ranges, reducing their dominance percentage slightly as capital rotates toward alternative assets. This rotation often benefits mid-cap altcoins when it occurs alongside improving market sentiment.
Technical analysts note that the accumulation patterns identified by Phoenix Group correspond with several traditional technical indicators. Many mid-cap assets are testing long-term support levels established during previous market cycles while showing improving relative strength against both Bitcoin and traditional assets. The 30-day moving averages for several identified assets have begun to flatten after declining through January, suggesting selling pressure may be exhausting. However, analysts caution that accumulation phases can extend for weeks or months before resulting in significant price movements.
Historical Precedents and Market Cycle Comparisons
Examining previous market cycles provides context for the current accumulation patterns. Similar mid-cap accumulation occurred in late 2020 before the 2021 altcoin expansion, and again in mid-2023 preceding the 2024 market recovery. These historical periods shared several characteristics with current conditions: reduced volatility following corrective phases, improving fundamentals across multiple projects, and increasing development activity within blockchain ecosystems.
The table below compares key metrics from previous accumulation periods with current February 2026 data:
| Metric | Q4 2020 | Q2 2023 | February 2026 |
|---|---|---|---|
| Average Exchange Outflows | 15-20% | 12-18% | 10-16% |
| Large Transaction Increase | 45% | 38% | 32% |
| Days in Accumulation Zone | 42 | 56 | 28 (ongoing) |
| Subsequent 90-Day Performance | +210% | +165% | TBD |
These historical comparisons suggest that while current accumulation patterns resemble previous cycles, each period maintains unique characteristics based on market maturity, regulatory environment, and technological development. The cryptocurrency market of 2026 operates within a more established regulatory framework and with greater institutional infrastructure than during previous cycles, potentially affecting the duration and intensity of accumulation phases.
Expert Perspectives on Current Market Dynamics
Financial analysts specializing in digital assets emphasize the importance of distinguishing between strategic accumulation and routine market activity. Dr. Elena Rodriguez, a blockchain economist at Stanford University, notes that “accumulation patterns must be evaluated within the broader context of market liquidity, regulatory developments, and macroeconomic conditions. The current environment features moderating inflation in major economies and stabilizing interest rates, which historically supports risk asset appreciation.”
Market structure experts point to increasing institutional participation as a factor that may be influencing accumulation patterns. Unlike retail-driven markets of earlier cycles, current conditions include significant participation from regulated investment vehicles, corporate treasuries, and asset managers implementing longer-term allocation strategies. This institutional presence may contribute to more gradual, sustained accumulation rather than the rapid accumulation phases observed in previous retail-dominated markets.
Potential Implications for Market Structure and Investor Strategy
The accumulation patterns identified in Phoenix Group’s snapshot suggest several potential market developments. If sustained, these patterns could indicate the early stages of capital rotation from large-cap cryptocurrencies to mid-cap altcoins with specific fundamental strengths. This rotation typically occurs when investors perceive reduced systemic risk and increasing confidence in alternative blockchain projects.
For market participants, these patterns warrant careful monitoring rather than immediate action. Accumulation phases represent only one component of comprehensive market analysis. Investors typically combine these technical signals with fundamental research on specific projects, evaluation of development roadmaps, and assessment of competitive positioning within respective sectors. The current accumulation appears concentrated in projects with clear utility, sustainable tokenomics, and demonstrated adoption metrics rather than speculative assets without established use cases.
Market educators emphasize that accumulation zones represent potential opportunities but require confirmation through subsequent price action and volume patterns. Novice investors sometimes misinterpret routine volatility as accumulation, leading to premature positioning. Professional traders typically wait for multiple confirmations across different timeframes and metrics before considering accumulation signals validated.
Conclusion
Phoenix Group’s February 2026 market snapshot reveals developing accumulation trends among mid-cap altcoins, suggesting sophisticated investors may be positioning for potential market developments. These patterns warrant attention within the broader context of improving blockchain fundamentals, stabilizing macroeconomic conditions, and increasing institutional participation. While historical precedents suggest accumulation phases often precede significant price movements, market participants should consider these signals as one component of comprehensive analysis rather than standalone indicators. The evolving cryptocurrency market of 2026 continues to demonstrate increasing maturity, with accumulation patterns reflecting more measured, fundamentally-driven investment strategies compared to earlier market cycles.
FAQs
Q1: What exactly is an “accumulation zone” in cryptocurrency markets?
An accumulation zone refers to a price range where informed investors systematically acquire assets over an extended period, typically during market consolidation or after price declines. This behavior suggests confidence in future appreciation despite current market conditions.
Q2: How does Phoenix Group identify accumulation patterns?
Phoenix Group uses a multi-factor approach analyzing exchange net flows, large transaction volumes, supply distribution changes, and technical price structures. They require convergence across these metrics to distinguish strategic accumulation from routine market activity.
Q3: Why are mid-cap altcoins specifically showing accumulation patterns?
Mid-cap altcoins often attract accumulation during market transitions because they offer greater growth potential than large-cap assets while presenting less risk than micro-cap projects. They typically have established fundamentals but more room for expansion than market leaders.
Q4: How long do accumulation phases typically last?
Historical accumulation phases in cryptocurrency markets have ranged from 30 to 90 days, though there’s significant variation based on market conditions. The current patterns identified in February 2026 have been developing for approximately 28 days according to the report.
Q5: Does accumulation guarantee future price increases?
No, accumulation patterns suggest investor interest but don’t guarantee price appreciation. These signals require confirmation through subsequent price action, volume patterns, and alignment with fundamental developments. Market conditions can always change based on external factors.
Q6: How should investors respond to these accumulation signals?
Investors should monitor these patterns as part of comprehensive market analysis rather than taking immediate action. Professional traders typically wait for multiple confirmations across different metrics and timeframes before considering accumulation signals validated for investment decisions.
Related News
- Exciting Coinone ASTER Listing: South Korean Exchange Boosts Crypto Accessibility
- Tencent Cloud Announces New Web3 Initiatives
- Binance Perpetual Futures: Strategic Expansion with BIRB and GWEI Listings
Related: Zircuit Finance Unveils Groundbreaking Institutional-Grade Onchain Yield Platform
Related: Real-Time Crowd Gaming Revolution Begins as Weaver Labs Joins Piing at MK Dons Stadium
Related: Spartans Winter Olympics Crypto Betting Dominates with 33% CashRake as NY Spins and Betfair Struggle