The cryptocurrency market is a whirlwind of rapid movements, and recent days have seen **XRP Price** take center stage with a dramatic 17% decline. This sharp pullback has sent ripples across the community, triggering over $114 million in **crypto liquidations** and leaving many wondering about XRP’s immediate future. But don’t let the headlines mislead you; a deeper dive into **XRP technical analysis** reveals that this significant drop might just be a strategic reset, with strong indicators pointing towards a potential bullish recovery. Let’s unpack what’s truly happening and what it means for your investments.
The Dramatic Drop: Unpacking XRP Price Plunge and $114M Crypto Liquidations
In a span of just two days, XRP experienced a substantial 17% drop, a move that undoubtedly caught many off guard. This rapid descent was accompanied by a massive wave of **crypto liquidations**, totaling over $114 million. For those unfamiliar, liquidations occur when leveraged trading positions are automatically closed by exchanges because the market moves against the trader, and their collateral falls below a required level. This process often accelerates price movements, turning a significant dip into a cascading sell-off as more positions are forced closed.
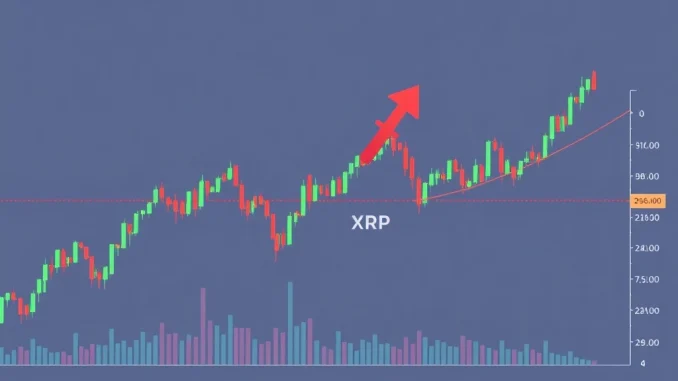
The intensity of this price action was underscored by a pronounced red candle on July 23, witnessing nearly 200 million XRP tokens traded. Such high trading volume during a sharp decline indicates heightened market volatility and significant selling pressure. However, it also suggests that many short-term positions were flushed out, potentially clearing the path for a more stable rebound. This kind of volatility is not uncommon in the crypto space, but understanding its underlying mechanics is crucial for navigating such turbulent waters.
Decoding XRP Technical Analysis: Is a Bullish Rebound Brewing?
Despite the alarming headlines, a closer look at **XRP technical analysis** paints a more nuanced and, surprisingly, optimistic picture. Key indicators suggest that XRP remains within a bullish trajectory, viewing the recent correction as a healthy consolidation phase rather than a fundamental breakdown.
One of the most critical tools for gauging near-term directionality in this scenario is the **Bollinger Bands**. These dynamic envelopes, plotted around a simple moving average, provide a visual representation of price volatility and potential support/resistance levels. The recent price pullback has brought XRP precisely towards the Bollinger Bands midline at $2.91. Historically, this midline has acted as a pivotal support zone, often signaling an inflection point where prices might reverse or consolidate before resuming an upward trend.
Furthermore, analysts note that even with the surge in volatility and trading volume, the **XRP Price** has managed to stay above key short-term moving averages. This resilience reinforces sustained market strength and suggests that underlying buyer demand is still present, preventing a deeper collapse. This technical configuration implies that the current correction is a necessary reset, allowing the market to absorb recent gains and recalibrate ahead of potential renewed upward momentum.
Key Technical Observations:
- Bollinger Bands Midline ($2.91): A critical support level; holding above it reinforces buyer strength.
- Short-Term Moving Averages: Price remaining above these averages indicates sustained market strength.
- Consolidation Phase: The current pullback is seen as a healthy market reset, not a bearish reversal.
What Does This XRP News Mean for Traders and Investors?
The latest **XRP news** highlights the importance of technical indicators in navigating market fluctuations, especially in an environment prone to external uncertainties. The resilience of the $2.90–$3.00 range is paramount. Sustaining prices above this threshold could reaffirm buyer strength and pave the way for a rebound towards the upper Bollinger Band.
Market sentiment, though cautious, remains optimistic. The correction is largely viewed as a necessary step for the market to shed over-leveraged positions and prepare for future growth. This consolidation phase allows for a healthier price discovery mechanism, where fundamental value can eventually catch up with technical momentum.
While XRP’s fundamentals remain robust, traders are currently prioritizing technical cues. The Bollinger Bands’ compressed range, a pattern often preceding significant price movements, emphasizes the need to monitor volume patterns and order flow for directional cues. This period of tighter range trading could be setting the stage for a breakout in either direction, making vigilance key.
Actionable Insights for Navigating XRP’s Volatility:
- Monitor the $2.90-$3.00 Support Zone: Its resilience is crucial for maintaining the bullish outlook. A decisive break below $2.90 could extend the pullback into a deeper correction.
- Watch Volume and Order Flow: Significant shifts in trading volume or large order blocks can signal changes in trend dynamics.
- Understand the Broader Context: While not directly tied to XRP’s recent drop, regulatory developments, such as the U.S. Securities and Exchange Commission’s (SEC) delayed decision on a proposed ETF (pushed to July 24, 2025), underscore a climate of uncertainty that can amplify volatility across digital assets.
- Risk Management: Given the inherent volatility, employing sound risk management strategies, such as setting stop-loss orders, is always advisable.
In summary, XRP’s recent pullback, while significant in terms of **crypto liquidations** and immediate **XRP Price** impact, does not undermine its overall technical structure. The **XRP technical analysis** using **Bollinger Bands** indicates the asset remains within a healthy trading range. This correction is best understood as a strategic reset rather than a breakdown, and maintaining the $2.90–$3.00 range will be essential for preserving the positive outlook. Investors and traders are encouraged to monitor these critical levels closely as the market navigates the next phase of its trajectory.
Frequently Asked Questions (FAQs)
Q1: What caused the recent 17% drop in XRP Price?
The recent 17% drop in **XRP Price** was a significant market correction, likely triggered by a combination of factors including broader market volatility, profit-taking after previous gains, and the cascading effect of **crypto liquidations** which forced the closure of many leveraged trading positions. While no single event was solely responsible, these elements combined to create a sharp, rapid decline.
Q2: What are crypto liquidations, and why are they important?
Crypto liquidations refer to the forced closure of a trader’s leveraged position by an exchange due to insufficient margin to cover potential losses. When the market moves significantly against a leveraged position, the exchange automatically sells the collateral to prevent further losses. The $114 million in liquidations seen with XRP are important because they indicate a large number of over-leveraged positions were wiped out, often leading to amplified price drops but also potentially clearing the market for a healthier rebound.
Q3: How do Bollinger Bands help in understanding XRP’s trajectory?
**Bollinger Bands** are a popular technical analysis tool that helps measure market volatility and identify potential overbought or oversold conditions. For XRP, the price pullback to the Bollinger Bands midline at $2.91 is significant. This midline often acts as a strong support level. If XRP holds above it, it suggests the correction is a healthy consolidation and a potential bounce is likely, maintaining a bullish outlook.
Q4: Is the $2.90-$3.00 price range crucial for XRP?
Yes, the $2.90-$3.00 range is highly crucial for XRP. This zone is identified as a critical support level. If **XRP Price** can sustain itself above this range, it would strongly reaffirm buyer strength and support the narrative of a healthy market consolidation, setting the stage for renewed upward momentum. A decisive break below this range, however, could signal a deeper correction.
Q5: What is the overall market sentiment regarding XRP after this drop?
Despite the recent drop, the overall market sentiment for XRP remains cautiously optimistic. Many analysts view the correction as a necessary “strategic reset” rather than a fundamental reversal of its bullish trend. The focus is now on technical indicators, particularly the ability of XRP to hold key support levels, which would reinforce the potential for a rebound.
Q6: How do broader regulatory developments affect XRP News and its price action?
While not directly causing XRP’s recent price drop, broader regulatory developments, such as the SEC’s delayed decision on a proposed ETF (pushed to July 24, 2025), contribute to overall market uncertainty. This uncertainty can amplify volatility across digital assets, making traders rely more heavily on **XRP technical analysis** and short-term price dynamics to navigate the market rather than long-term fundamental narratives.


