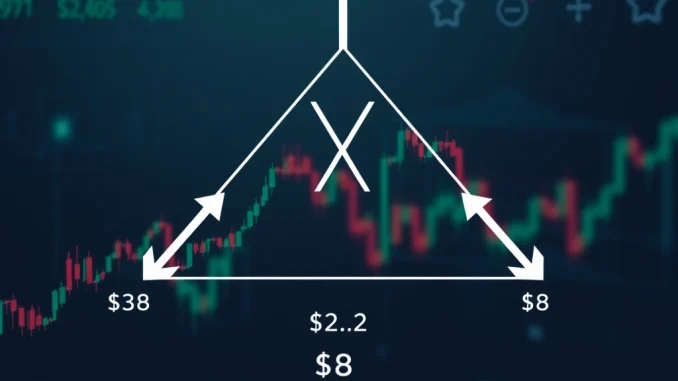
Is XRP on the verge of a monumental price surge? Excitement is building in the crypto community as technical analysis points towards a potential breakout that could send XRP soaring to unprecedented heights. Let’s dive into the analysis that suggests XRP could reach a staggering $8 if it decisively breaches a crucial resistance level. For those watching the crypto markets closely, especially XRP enthusiasts, this analysis presents a potentially lucrative opportunity.
Decoding the Symmetrical Triangle Pattern: The Key to XRP’s Potential Breakout
At the heart of this bullish XRP price prediction lies a technical chart pattern known as the symmetrical triangle. But what exactly is a symmetrical triangle, and why is it significant for XRP’s price trajectory? Think of it as a coiled spring, building up energy for a powerful move. Here’s a breakdown:
- Formation: A symmetrical triangle forms when XRP’s price makes lower highs and higher lows, converging towards a point. This creates the triangle shape on the chart.
- Indecision: This pattern often indicates a period of market indecision, where neither buyers nor sellers are in complete control. However, this equilibrium is typically temporary.
- Breakout Potential: The crucial aspect of a symmetrical triangle is its potential for a strong breakout. Once the price breaks out of the triangle pattern, it often signals the start of a significant price move in the direction of the breakout.
- Momentum Building: The narrowing price range within the triangle shows that momentum is building. As the price coils tighter, the eventual breakout tends to be more explosive.

Why $2.2 is the Critical Resistance Level for XRP?
According to prominent technical analyst DefendDark, shared on X (formerly Twitter), the $2.2 price point is a pivotal resistance level for XRP. Why is this particular level so important in this XRP Breakout scenario?
- Historical Significance: Resistance levels are price points where selling pressure has historically been strong enough to halt or reverse price increases. $2.2 likely represents a previous high or area where sellers previously stepped in.
- Psychological Barrier: Round numbers and previous highs often act as psychological barriers for traders. Breaking through $2.2 would signal to the market that bullish momentum is strong enough to overcome past resistance.
- Confirmation of Breakout: A decisive break above $2.2 would serve as confirmation that the symmetrical triangle pattern is indeed leading to an upward breakout. This confirmation could attract more buyers and further fuel the price ascent.
- Trigger for Target Calculation: Technical analysts often use the height of the symmetrical triangle to project potential price targets after a breakout. The $2.2 resistance level is the gateway to unlocking these higher targets.
XRP Price Prediction to $8: Is it Realistic?
DefendDark’s analysis suggests a mid-term target range of $5 to $8 for XRP if it successfully breaks above $2.2. While such a jump might seem ambitious, let’s examine the factors that could support this XRP to $8 target:
- Pattern Projection: Technical analysis targets are often derived from the patterns themselves. The height of the symmetrical triangle can be measured and added to the breakout point to estimate a potential target. A $5 to $8 target is likely calculated based on this methodology applied to the XRP chart.
- Market Sentiment Shift: A breakout above $2.2 could dramatically shift market sentiment towards XRP. Fear of missing out (FOMO) could drive significant buying pressure, pushing the price higher than purely technical targets might suggest.
- Broader Crypto Bull Run: If the overall cryptocurrency market enters a bull run, XRP, along with other altcoins, would likely benefit. A rising tide lifts all boats, and a strong bull market could provide the external fuel for XRP to reach these higher price levels.
- Fundamental Developments: While the current analysis is primarily technical, any positive fundamental developments surrounding Ripple and XRP (e.g., regulatory clarity, adoption by financial institutions) could act as catalysts to propel the price even further.

Navigating Crypto Technical Analysis: What You Need to Know
This Crypto Technical Analysis of XRP highlights the importance of understanding technical indicators and chart patterns. If you’re new to crypto trading or technical analysis, here are some key takeaways:
- Education is Key: Technical analysis is a skill that requires learning and practice. Explore resources, courses, and books to deepen your understanding of chart patterns, indicators, and risk management.
- Not a Guarantee: Technical analysis provides probabilities, not guarantees. Patterns can fail, and market conditions can change unexpectedly. Always trade responsibly and manage your risk.
- Combine with Fundamentals: For a more comprehensive view, combine technical analysis with fundamental analysis. Consider the project’s technology, team, adoption, and regulatory landscape.
- Use Multiple Timeframes: Analyze charts on different timeframes (e.g., daily, weekly) to get a broader perspective. Patterns on longer timeframes tend to be more significant.
- Start Small and Practice: Begin with paper trading or small positions to practice your technical analysis skills before risking significant capital.
Is Now the Time to Consider XRP? Actionable Insights
The analysis presented by DefendDark offers compelling reasons to watch XRP closely. Here are some actionable insights for those considering XRP based on this potential Symmetrical Triangle Pattern breakout:
| Actionable Insight | Description |
|---|---|
| Monitor $2.2 Resistance | Closely observe XRP’s price action around the $2.2 level. A decisive break above this level could signal the start of the predicted upward move. |
| Set Price Alerts | Use price alerts to be notified if XRP approaches or breaks through the $2.2 resistance. This allows you to react quickly to potential trading opportunities. |
| Manage Risk | If considering a trade, determine your risk tolerance and use appropriate risk management techniques, such as stop-loss orders. Never invest more than you can afford to lose. |
| Further Research | Don’t rely solely on one analysis. Conduct your own research, explore other technical indicators, and stay informed about broader market conditions and fundamental developments related to XRP. |
Conclusion: The Explosive Potential of XRP Awaits
The formation of a symmetrical triangle pattern in XRP’s price chart, coupled with the critical $2.2 resistance level, presents a potentially explosive scenario. While price predictions are never guaranteed, the technical analysis suggests that XRP could indeed surge towards the $5 to $8 range if it successfully breaks out. For crypto enthusiasts and traders, keeping a close eye on XRP’s price action and the $2.2 level could be incredibly worthwhile. The crypto market is known for its volatility and rapid shifts, and this analysis highlights a potential opportunity that could unfold in the near future. Will XRP break free and unleash its pent-up potential? Only time will tell, but the charts are certainly signaling a story worth watching.


