Hold onto your hats, Solana (SOL) enthusiasts! The crypto market is known for its volatility, and recent data suggests Solana could be bracing for another potential price swing. A recent warning from blockchain analytics firm Glassnode is sending ripples through the SOL community, highlighting a critical support level that could determine the cryptocurrency’s next move. Let’s dive deep into this Solana price analysis and understand what this means for your investments.
Why is the $94–$100 Range a Critical Solana Support Level?
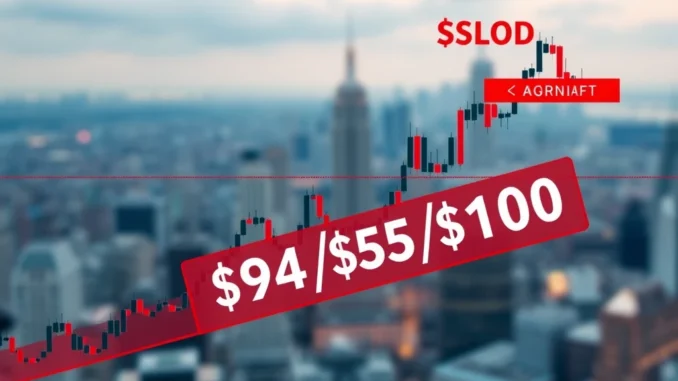
According to Glassnode, a significant chunk of the Solana supply is currently concentrated within the $94 to $100 price range. Using their UTXO Realized Price Distribution (URPD) data, Glassnode revealed on X (formerly Twitter) that approximately 21 million SOL tokens, representing 3.5% of the total supply, are held within this price bracket. This concentration makes the $94–$100 level a crucial Solana support level. But what exactly is URPD, and why is it important?
Understanding UTXO Realized Price Distribution (URPD)
For those unfamiliar, UTXO Realized Price Distribution (URPD) is a powerful on-chain metric that provides insights into the prices at which different portions of a cryptocurrency’s supply last moved. In simpler terms, it shows us the ‘realized price’ distribution of all unspent transaction outputs (UTXOs) in a blockchain. By analyzing URPD, we can identify price levels where a significant amount of tokens were last transacted, often indicating potential support and resistance zones. In Solana’s case, the URPD data is flashing a warning sign around the $94–$100 zone.
The Danger of a Support Breakdown
Glassnode’s warning isn’t to be taken lightly. They explicitly stated that a breakdown below this crucial Solana support level could lead to “sharp losses.” Why? Because below this range, the data suggests weaker support. Imagine a building with a strong foundation (the $94-$100 support). If that foundation crumbles, there isn’t much to hold the structure up, leading to a rapid collapse. Similarly, if Solana breaks below $94, the lack of strong support below could accelerate a downward price movement.
- High Supply Concentration: A significant 3.5% of Solana’s supply is clustered around $94–$100, making it a key battleground for bulls and bears.
- Weak Support Below: URPD data indicates less transactional activity and thus weaker support below the $94 mark.
- Potential for Sharp Decline: A breakdown could trigger stop-loss orders and panic selling, amplifying the downward pressure.
This isn’t to say a breakdown is inevitable, but it’s a critical scenario that traders and investors need to be aware of. What are the potential scenarios and price levels to watch out for?
Potential Scenarios and Key Price Levels for Solana (SOL)
While the $94–$100 support is under scrutiny, Glassnode also highlighted other important price levels that could influence Solana’s trajectory. Let’s break down the potential scenarios based on these levels:
Scenario 1: Stability at $123–$126 Accumulation Zone
According to Glassnode, there’s a potential accumulation zone around $123–$126. Accumulation in this context refers to a phase where investors are buying SOL, potentially absorbing selling pressure and establishing a base for future price appreciation. If Solana can find stability and consolidate within this range, it could signal renewed bullish momentum. Think of it as building a new, higher foundation after testing the lower support.
Scenario 2: Major Resistance at $135–$144 – A Potential Selling Pressure Trigger
On the upside, the $135–$144 range is identified as a major resistance zone. Resistance levels are price points where selling pressure tends to outweigh buying pressure, potentially halting upward movements. Glassnode suggests that this zone could trigger significant selling pressure. Why? Because investors who bought SOL at lower prices might see this level as an opportunity to take profits, and those who bought higher might be looking to break even or reduce their losses.
Here’s a table summarizing these key levels for a clearer picture:
| Price Level | Significance | Potential Outcome |
|---|---|---|
| $94–$100 | Critical Support | Breakdown could lead to sharp losses |
| $123–$126 | Accumulation Zone | Potential stability and bullish reversal |
| $135–$144 | Major Resistance | Potential selling pressure and price pullback |
What Does This Mean for Your Solana Investments? Actionable Insights
So, what should you do with this information? Here are some actionable insights for Solana investors and traders:
- Monitor the $94–$100 Support Closely: Keep a very close eye on how Solana behaves around this critical support level. A sustained break below $94, especially with increased trading volume, could be a bearish signal.
- Set Stop-Loss Orders (Consider Carefully): For traders, especially those in leveraged positions, consider using stop-loss orders below the $94 level to mitigate potential losses in case of a breakdown. However, be mindful of potential fakeouts and market volatility.
- Watch for Stability at $123–$126: If Solana can rebound and consolidate around the $123–$126 zone, it could be a positive sign. This might present buying opportunities for those looking to accumulate SOL for the longer term.
- Be Cautious Around $135–$144 Resistance: If the price approaches the $135–$144 resistance, be prepared for potential selling pressure. This could be a level to take profits or reduce exposure for short-term traders.
- Diversify Your Portfolio: Regardless of Solana’s short-term price action, remember the golden rule of investing – diversification. Don’t put all your eggs in one basket. Diversifying across different cryptocurrencies and asset classes can help manage risk.
- Stay Updated with Market Analysis: Market conditions are constantly evolving. Keep yourself informed with the latest crypto price prediction and Solana forecast from reputable sources like Glassnode and other on-chain analytics platforms.
Looking Ahead: Solana Forecast and Market Sentiment
Predicting the future of any cryptocurrency is inherently challenging, but understanding key support and resistance levels, as highlighted by Glassnode’s SOL price analysis, is crucial for informed decision-making. The current market sentiment appears to be cautious, given the warnings surrounding the $94–$100 support. However, the crypto market is known for its rapid shifts in sentiment. Positive developments in the broader crypto space, advancements in the Solana ecosystem, or increased adoption could potentially shift the narrative and lead to a bullish reversal.
Ultimately, whether Solana breaks down below $94, finds stability at $123–$126, or faces resistance at $135–$144 remains to be seen. The key takeaway is to be prepared, stay informed, and manage your risk wisely. This Solana forecast is based on current data, and the situation can change rapidly. Always do your own research and consider consulting with a financial advisor before making any investment decisions.
Conclusion: Navigating the Solana Price Landscape
The crypto market is a thrilling and often unpredictable space. The current Solana price action, particularly around the critical $94–$100 support level, serves as a potent reminder of the importance of technical analysis and on-chain data. Glassnode’s warning, based on URPD data, provides valuable insights into potential risks and opportunities for Solana. By understanding these key levels and potential scenarios, investors and traders can navigate the Solana price landscape with greater awareness and make more informed decisions. Remember to stay vigilant, adapt to market changes, and always prioritize risk management in your crypto journey. The crypto price prediction landscape is ever-evolving, and staying ahead of the curve is paramount for success.


