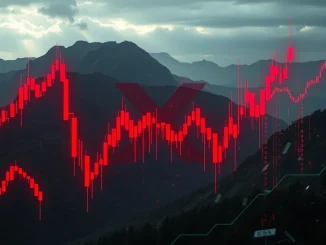
The crypto world is abuzz with the latest news from the Solana ecosystem. On July 23, 2025, Solana (SOL) experienced a significant 9.5% price decline, shaking the confidence of many traders. This dramatic drop, which saw SOL fall from $205 to $186, was primarily triggered by a staggering $30 million in long-position liquidations, marking its most substantial daily correction since early March. For anyone tracking the **Solana price**, this event underscores the volatile nature of the cryptocurrency market and the critical role that leveraged trading plays in price movements.
What Triggered the Sudden Solana Price Plunge?
The recent downturn in **Solana price** wasn’t an isolated event but rather the culmination of several market pressures. A ‘long squeeze’ scenario played a pivotal role, forcing leveraged traders to close their positions as SOL’s price moved against them. This cascading effect amplified the downward momentum. Here’s a breakdown of the key factors:
- Elevated Open Interest: Prior to the correction, open interest in SOL futures had soared to an all-time high of $12 billion. This indicated a significant number of leveraged long positions, making the market ripe for a squeeze.
- Surging Funding Rates: Funding rates, which are periodic payments exchanged between long and short traders, reached their highest levels in the past quarter. High funding rates typically signal an overcrowded long trade, making it expensive to hold long positions and increasing the risk of liquidations.
- Bearish Divergence in CVD: A bearish divergence in futures cumulative volume delta (CVD) was observed. This technical signal suggested that short-sellers were actively taking profits or increasing their bearish bets before the major price drop, further accelerating the downward pressure once the correction began.
These elements combined to create a perfect storm, leading to the rapid unwinding of long positions and the subsequent sharp decline in Solana’s valuation.
SOL Liquidations: A Deep Dive into the $30M Event
The $30 million in **SOL liquidations** serves as a stark reminder of the risks associated with high-leverage trading in volatile assets like cryptocurrencies. When a trader’s margin falls below a certain level due to adverse price movements, their positions are automatically closed by the exchange to prevent further losses. This forced selling can exacerbate price declines, creating a feedback loop where more liquidations lead to further price drops, and so on.
The scale of these liquidations indicates a significant number of traders were caught off guard, highlighting the importance of robust risk management strategies. While such events can be painful for individual traders, they often act as a ‘market reset,’ flushing out excessive leverage and potentially setting the stage for more sustainable growth. Understanding the mechanics of **SOL liquidations** is crucial for any trader navigating the crypto landscape.
Is Solana Technical Analysis Signaling a Reversal or Further Downtrend?
Despite the sharp pullback, many analysts are closely watching key technical indicators to determine Solana’s next move. According to COINOTAG analysts, the market is likely consolidating gains rather than entering a full-blown bearish phase. A critical focus point from a **Solana technical analysis** perspective is the $180 level.
- Critical Support at $180: This level is seen as a crucial support zone, validated by a bullish break of structure (BOS) earlier in the week. It represents the first major upward trend shift on the daily timeframe since November 2024. Maintaining support above $180 is paramount for reinforcing bullish momentum.
- The Golden Cross: A significant bullish signal recently emerged: the 50-day exponential moving average (EMA) crossed above the 200-day EMA. This ‘golden cross’ is historically associated with strong bullish trends. Notably, the last golden cross in late 2023 preceded a massive 730% price surge over several months, offering a compelling precedent for future performance if the pattern holds.
While the immediate price action was negative, these underlying technical strengths suggest resilience. Traders will be keenly observing if SOL can hold this vital **SOL support level** to confirm a continuation of its broader uptrend.
Navigating the Crypto Market Correction: What Traders Need to Know About the SOL Support Level
For traders and investors, understanding how to navigate this **crypto market correction** is key. The $180 **SOL support level** is currently the most important area to watch. A sustained hold above this threshold could attract renewed buying interest, potentially extending Solana’s upward trajectory. This would signal that the recent drop was merely a healthy correction within a larger bullish trend.
Conversely, a breakdown below $180 could expose Solana to a deeper retracement. The next significant support range would then be between $168 and $157. This zone aligns with a daily fair value gap and Fibonacci retracement levels (0.5 to 0.618), which are commonly regarded as high-probability areas for price consolidation or reversal. The broader market context suggests that while Solana’s rally has been strong, such corrections are a natural part of its growth cycle.
Elevated open interest and funding rates continue to pose risks, underscoring the need for cautious positioning and robust risk management strategies. While the $180 support and the golden cross signal resilience, traders should balance optimism with prudence, given the potentially overcrowded long trade environment. The interplay between technical indicators and market sentiment will ultimately determine whether Solana’s bullish trend persists or gives way to further volatility.
Conclusion: Solana’s Resilience Tested
The recent 9.5% dip in Solana’s price, fueled by $30 million in liquidations, serves as a powerful reminder of the inherent volatility in the crypto markets. However, a deeper dive into **Solana technical analysis** reveals critical support levels and bullish indicators like the Golden Cross, which suggest underlying strength. While the immediate future hinges on SOL maintaining the crucial $180 **SOL support level**, the broader outlook remains cautiously optimistic. Traders must remain vigilant, employing sound risk management, as the market navigates this period of consolidation. The coming days will be pivotal in determining whether Solana continues its impressive upward trajectory or faces a deeper correction.
Frequently Asked Questions (FAQs)
Q1: What caused Solana’s recent 9.5% price drop?
Solana’s price drop on July 23, 2025, was primarily caused by $30 million in long-position liquidations, triggered by a ‘long squeeze’ scenario. This was exacerbated by elevated open interest in SOL futures and surging funding rates, indicating an overcrowded long trade environment.
Q2: What is a ‘long liquidation’ in cryptocurrency trading?
A long liquidation occurs when a trader who has bought (gone ‘long’) an asset with borrowed funds sees its price fall to a point where their margin collateral is no longer sufficient. The exchange automatically closes their position to prevent further losses, often leading to increased selling pressure in the market.
Q3: What is the significance of the $180 support level for Solana?
The $180 level is considered a critical support zone for Solana. It represents a key technical level validated by a recent bullish break of structure and is seen as the first major upward trend shift since November 2024. Maintaining support above this level is crucial for reinforcing bullish momentum and preventing further significant price declines.
Q4: What is a ‘Golden Cross’ in Solana’s technical analysis, and why is it important?
A ‘Golden Cross’ in Solana’s technical analysis refers to the 50-day Exponential Moving Average (EMA) crossing above the 200-day EMA. This is widely considered a strong bullish signal, often preceding significant price rallies. The last golden cross in late 2023 preceded a 730% price surge for SOL, making its recent appearance particularly noteworthy for potential future performance.
Q5: Is Solana entering a bearish phase after this correction?
While the 9.5% drop was significant, analysts suggest that Solana is more likely consolidating gains rather than entering a bearish phase, provided it maintains support above the $180 level. The presence of a ‘golden cross’ also indicates underlying bullish strength. However, traders should remain cautious due to elevated open interest and funding rates.
Q6: What should traders consider when trading SOL given current market conditions?
Traders should prioritize robust risk management, especially given elevated open interest and funding rates. Monitoring the $180 support level is crucial; a sustained hold could signal renewed buying interest, while a breakdown might lead to further retracement towards the $168-$157 range. Balancing optimism with prudence is key in this volatile environment.