The cryptocurrency market is buzzing with renewed energy, and leading the charge is a significant surge in Ethereum (ETH) and a captivating rally for Render (RENDER). If you’ve been watching the charts, you’ve likely noticed the excitement. Today’s Ethereum news has set a positive tone, spilling over into altcoins, with Render experiencing a remarkable 5% jump in a single day, extending its impressive monthly rally to 37%. But what’s truly capturing the attention of technical analysts is a compelling bullish fractal pattern emerging in Render’s price action, drawing striking parallels to Ethena’s recent explosive 66% breakout. Could Render be on the cusp of a similar monumental climb?
Ethereum News Ignites the Altcoin Rally
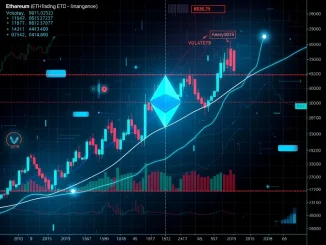
On July 26, 2025, the broader cryptocurrency market experienced a vigorous rebound, with Ethereum (ETH) leading the charge with a surge of over 3%. This significant movement in the second-largest cryptocurrency often acts as a catalyst, injecting optimism and capital into the wider altcoin ecosystem. When Ethereum shows strength, it creates a ripple effect, boosting investor confidence and paving the way for smaller cap tokens to follow suit. This positive sentiment is a crucial backdrop to understanding the current momentum behind tokens like Render. The prevailing Ethereum news highlights a market showing resilience and a renewed appetite for risk, setting the stage for potential gains across various sectors, including AI-focused projects like Render.
Unpacking the Bullish Fractal Pattern: Render vs. Ethena
Technical analysis often relies on identifying recurring patterns, or fractals, that suggest similar future price movements. In the case of Render (RENDER), analysts are pointing to a fascinating bullish fractal that closely mirrors the trajectory of Ethena (ENA) prior to its massive breakout. A fractal, in this context, refers to a repeating pattern on a price chart that can provide clues about future direction.
Let’s break down the striking similarities:
- Falling Wedge Breakout: Both ENA and RENDER exhibited a “falling wedge” pattern. This is a classic bullish reversal formation, typically indicating that selling pressure is waning and a breakout to the upside is imminent. ENA successfully broke out of its wedge, signaling the start of its rally. RENDER has recently followed suit, escaping its own falling wedge.
- Reclaiming Key Moving Averages: ENA reclaimed its 100-day moving average, a significant indicator of bullish momentum. RENDER is now testing and attempting to sustain above its 100-day moving average, currently around $4.02. Maintaining this level is crucial for the fractal’s validity.
- Retesting Resistance: After breaking out, ENA retested prior resistance levels before its explosive move. RENDER is currently retesting a critical resistance zone near $4.66. This retest is a pivotal juncture, mirroring ENA’s pre-rally consolidation phase and offering a potential springboard for the next leg up.
This compelling bullish fractal suggests that Render might be tracing a path already paved by Ethena, offering a potential roadmap for its next significant move.
What’s Driving the Render Price Surge?
Beyond the technical patterns, several factors contribute to the current surge in Render price. As an AI-focused token, Render benefits from the broader narrative around artificial intelligence, which continues to attract significant investment and attention in the tech world. The project’s fundamentals, centered around decentralized GPU rendering, position it uniquely within the blockchain space, offering real-world utility. The recent 5% daily surge and 37% monthly rally indicate strong buying interest and growing confidence among investors in Render’s long-term potential. The retest of the $4.66 resistance level is a critical moment; if Render can firmly establish support above this zone, it could unlock significant upward momentum.
Key Price Levels to Watch for Render:
- Support: $4.02 (100-day Moving Average) – Maintaining above this level is vital for the bullish case.
- Resistance Turned Support: $4.66 – A confirmed breach and hold above this level would be a strong bullish signal.
- Potential Target: $7.00 – This target aligns with the magnitude of Ethena’s breakout and would represent a significant gain from current levels.
Learning from Ethena ENA’s Historic Breakout
The comparison to Ethena ENA is not merely academic; it provides a historical precedent for what Render might achieve. Ethena’s breakout from its falling wedge pattern allowed it to not only reclaim key moving averages but also pierce significant resistance levels, culminating in a remarkable 66% price surge. This dramatic increase serves as a powerful example of how a confirmed bullish fractal can play out in the volatile crypto markets. Investors are closely watching to see if Render can replicate Ethena’s performance, using its prior trajectory as a potential blueprint for its own explosive growth phase. While past performance doesn’t guarantee future results, the striking similarities offer a compelling narrative for traders.
Navigating the Current Crypto Rebound: Key Insights
The current market environment, characterized by a robust crypto rebound, offers both opportunities and risks. While Ethereum’s recovery is certainly fueling optimism across the sector, investors must remain vigilant. The market remains inherently volatile, influenced by shifting regulatory landscapes, global macroeconomic signals, and unpredictable on-chain metrics. While fractal-based analysis provides a compelling framework, it underscores the paramount importance of observing actual price action and adherence to technical levels rather than relying solely on speculative forecasts. Diversification, risk management, and continuous monitoring of market developments are crucial for navigating this dynamic landscape successfully.
Summary: Is Render Primed for an Explosive Move?
The recent surge in Render (RENDER), bolstered by positive Ethereum news and a compelling bullish fractal mirroring Ethena’s impressive breakout, has undoubtedly put it on the radar of many crypto enthusiasts. The technical setup, particularly the breakout from the falling wedge and the retest of critical resistance at $4.66, suggests that Render could indeed be poised for a significant upward trajectory, potentially targeting $7.00. However, the integrity of this bullish case hinges on the token sustaining above its 100-day moving average at $4.02. As always, the cryptocurrency market demands careful consideration of both technical indicators and broader market sentiment. While the fractal offers a tantalizing glimpse into Render’s potential future, prudent investors will continue to monitor key levels and market dynamics closely to make informed decisions.
Frequently Asked Questions (FAQs)
Q1: What is a bullish fractal pattern in cryptocurrency?
A bullish fractal pattern in cryptocurrency refers to a recurring price chart formation that suggests a similar upward price movement might occur again. It’s a concept used in technical analysis where past price behavior is seen as a potential indicator of future trends, often involving specific breakout patterns from consolidation phases.
Q2: How is Render (RENDER) related to Ethereum (ETH)?
Render (RENDER) is an AI-focused token that operates within the broader cryptocurrency ecosystem, which is heavily influenced by Ethereum (ETH). While Render is its own project with unique utility (decentralized GPU rendering), a strong performance by Ethereum often creates positive market sentiment that benefits altcoins like Render, leading to increased investor interest and capital flow.
Q3: What was Ethena (ENA)’s breakout, and why is it relevant to Render?
Ethena (ENA) experienced a significant price surge of 66% after breaking out of a “falling wedge” pattern and reclaiming key technical levels. This event is relevant to Render because technical analysts observe a similar “bullish fractal” pattern forming in Render’s price action. The comparison suggests that Render might follow a similar trajectory of explosive growth if the pattern holds true.
Q4: What are the key price levels to watch for Render (RENDER)?
For Render (RENDER), key price levels to monitor include the 100-day moving average at approximately $4.02, which acts as crucial support. A significant resistance level to watch is $4.66; a sustained break above this could confirm further upward movement. If the bullish fractal plays out, a potential target for Render is around $7.00.
Q5: Is investing in Render (RENDER) guaranteed to follow Ethena’s path?
No, past performance, even in the case of a bullish fractal, does not guarantee future results. While the technical similarities between Render and Ethena are compelling, the cryptocurrency market is highly volatile and influenced by numerous factors, including macroeconomic conditions and regulatory changes. Investors should conduct their own research and exercise caution.