The cryptocurrency market is buzzing as Bitcoin’s price continues its upward trajectory, eyeing the significant psychological level of $100,000. While excitement builds, professional traders and analysts are closely monitoring potential pitfalls. One key indicator highlighting potential volatility is the risk of significant Bitcoin liquidation.
Understanding Bitcoin Liquidation Risk with CoinGlass
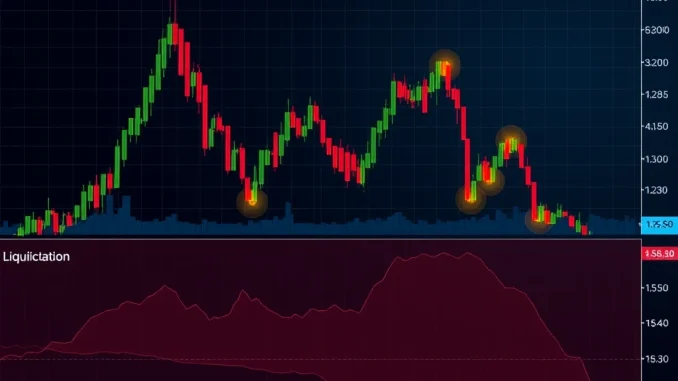
Data from platforms like CoinGlass provide valuable insights into market dynamics by visualizing where large volumes of leveraged trading positions are concentrated. These visualizations, often called liquidation maps, show the price levels at which these positions would be automatically closed out, or ‘liquidated’, if the market moves against them. This forced selling can trigger rapid price movements.
According to recent data from the CoinGlass Exchange Liquidation Map, a substantial amount of capital is currently exposed to this risk as Bitcoin price nears the $100,000 mark.
What the CoinGlass Map Reveals
The latest data from CoinGlass paints a clear picture of the potential liquidation zones:
- Short Positions at Risk: A staggering total of $3.35 billion in short positions are concentrated around the $100,002 price level. If Bitcoin price reaches or surpasses this point, these positions could face liquidation.
- Long Positions at Risk: While less significant in volume compared to the shorts at $100K, the map also indicates $864.02 million in long positions are at risk of liquidation around the $95,938 level. A dip below this price could trigger these liquidations.
- Data Source: This liquidation data is compiled from major cryptocurrency exchanges, including Binance, OKX, and Bybit, tracking activity over the past 30 days.
This concentration of short positions near a major psychological level like $100,000 is particularly noteworthy. As price approaches this level, the potential for a cascade of forced buying (as short positions are covered) increases, which could potentially accelerate the upward movement, often referred to as a ‘short squeeze’.
Why Does Bitcoin Liquidation Matter for Traders?
Understanding potential Bitcoin liquidation levels is crucial for anyone involved in crypto trading, especially those using leverage. Here’s why:
- Increased Volatility: Large liquidations can cause sudden and sharp price movements. A wave of short liquidations can fuel a rapid price increase, while long liquidations can cause a quick price drop.
- Market Sentiment Indicator: High concentrations of short positions near resistance levels (like $100K) suggest significant bearish bets are being placed. Their liquidation indicates these bets were wrong, potentially shifting market sentiment.
- Risk Management: Traders can use liquidation maps from platforms like CoinGlass to identify potential areas of support or resistance where volatility might spike, helping them refine their entry and exit strategies and manage risk more effectively.
- Identifying Potential Price Targets: Liquidation levels can sometimes act as magnets for price, as large players may attempt to push the price towards these levels to trigger liquidations and capitalize on the resulting volatility.
What Does This Mean for Bitcoin Price Prediction?
While liquidation maps are not crystal balls for Bitcoin price prediction, they offer a probabilistic view of potential market reactions at specific levels. The significant $3.35 billion in short positions near $100,002 suggests that if Bitcoin breaks through this level, the subsequent liquidations could add significant momentum to the move. Conversely, failure to break $100K and a move down towards $95,938 could trigger long liquidations, adding selling pressure.
It’s important to remember that these maps represent *potential* liquidation. Market conditions can change rapidly, and not all positions at risk will necessarily be liquidated immediately or simultaneously. However, the concentration of risk is a factor that cannot be ignored in crypto trading analysis.
Challenges and Considerations
While data from CoinGlass and similar platforms is valuable, it’s essential to consider its limitations:
- Partial Data: While major exchanges are included, not all trading platforms may contribute data, providing only a partial view of the total market risk.
- Dynamic Nature: Liquidation levels are constantly changing as traders open and close positions. The map is a snapshot in time.
- Correlation vs. Causation: Liquidation maps highlight areas of potential volatility, but they don’t guarantee price will reach those levels or that liquidations will trigger the predicted outcome. External factors, news, and broader market sentiment also play significant roles in Bitcoin price movements.
Actionable Insights for Traders
Given the insights from CoinGlass, traders might consider the following:
- Monitor $100K Closely: This level is not just a psychological barrier but also a major liquidation zone for short positions. A break above could be swift.
- Be Aware of $95,938: A potential dip below this level could accelerate downward movement due to long liquidations.
- Use Stop-Loss Orders: Regardless of potential liquidation levels, robust risk management through stop-loss orders is crucial in volatile markets.
- Combine Data Sources: Use liquidation maps in conjunction with other technical analysis tools and fundamental factors for a more comprehensive Bitcoin price prediction.
Conclusion: Navigating the Path to $100K
As Bitcoin price continues its ascent towards the $100,000 milestone, the data from CoinGlass serves as a stark reminder of the significant Bitcoin liquidation risk present in the market. The $3.35 billion in short positions poised for liquidation near $100,002 highlights a critical level that could trigger substantial volatility. While not a definitive Bitcoin price prediction tool, understanding these liquidation zones is vital for navigating the market safely. Traders engaged in crypto trading should use this information as part of their broader analysis and risk management strategy, staying vigilant as price action unfolds around these key levels.


