Is the crypto winter finally showing signs of thawing for Ethereum? Savvy investors are always on the lookout for signals, and recent on-chain data from Glassnode is hinting at a potentially lucrative opportunity. Could we be witnessing the elusive short-term bottom for ETH? Let’s dive into what the data reveals and what it could mean for your crypto portfolio.
Ethereum’s Cost Basis Distribution: A Sign of Accumulation?
Glassnode, a leading on-chain analytics firm, recently highlighted a significant shift in Ethereum’s Cost Basis Distribution (CBD). In a nutshell, CBD represents the aggregate price at which different cohorts of investors acquired their ETH. Here’s the key takeaway:
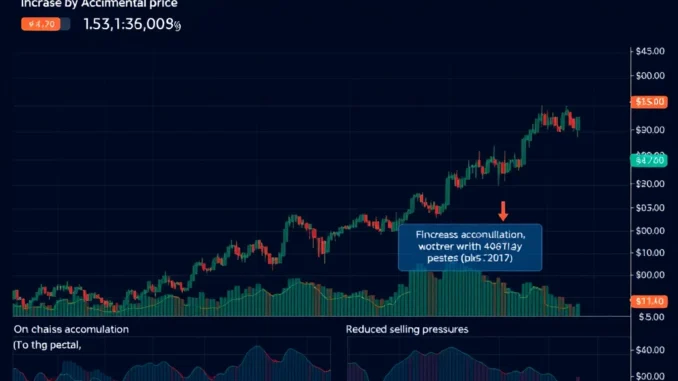
- Significant Increase in CBD at $1,886: Glassnode reported a notable surge in the CBD around the $1,886 price level. This isn’t just a minor fluctuation; it’s a substantial jump from 1.6 million ETH to 1.9 million ETH.
- What does this mean? This increase indicates that a considerable amount of ETH has recently been accumulated by investors at this price point. Think of it as a growing cluster of buy orders being filled around $1,886.
- Investor Confidence? Such a significant accumulation at a specific price suggests that investors are viewing $1,886 as an attractive entry point. They are essentially establishing a stronger support level for ETH price.
 Visual representation of Ethereum’s Cost Basis Distribution increasing at $1,886. Source: Glassnode (Hypothetical Image)
The Capitulation Metric: Gauging Market Sentiment
To further strengthen their analysis, Glassnode also referenced their Capitulation Metric. This sophisticated indicator attempts to gauge the degree of market capitulation by considering two critical factors:
- Realized Losses: This measures the total losses investors are realizing by selling their ETH at a loss. High realized losses often accompany market bottoms as weak hands panic sell.
- Weighted Sell Volumes: This analyzes the volume of ETH being sold, giving more weight to larger sell orders. High weighted sell volumes during downturns can signal intense selling pressure.
By combining these factors, the Capitulation Metric aims to identify periods where the market is experiencing peak fear and selling pressure – conditions often associated with market bottoms.
Why is On-Chain Data Important for Ethereum Analysis?
In the world of cryptocurrencies, on-chain analysis provides a unique and transparent lens into market dynamics. Unlike traditional financial markets where data can be opaque and fragmented, blockchain transactions are publicly recorded and auditable. This offers several advantages for investors:
- Transparency: Every transaction on the Ethereum blockchain is recorded, providing a clear and verifiable record of activity.
- Real-Time Insights: On-chain data updates in real-time, allowing analysts to track market movements as they happen.
- Investor Behavior: On-chain metrics can reveal insights into the behavior of different investor cohorts, such as accumulation trends, holding patterns, and transaction volumes.
- Identifying Trends: By analyzing on-chain data, analysts can identify emerging trends and patterns that may not be apparent from price charts alone.
Is This Really a Short-Term Bottom? Considerations and Caveats
While Glassnode’s analysis is certainly encouraging, it’s crucial to approach any market signals with a balanced perspective. Here are some key considerations:
- Short-Term vs. Long-Term: The data suggests a potential short-term bottom. This doesn’t necessarily guarantee a sustained bull run. Market conditions can change rapidly.
- Broader Market Factors: Ethereum’s price is influenced by a multitude of factors beyond on-chain data, including macroeconomic conditions, regulatory developments, and overall crypto market sentiment.
- Confirmation Needed: While on-chain data provides valuable signals, it’s often prudent to seek confirmation from other technical and fundamental indicators before making investment decisions.
- Not Financial Advice: It’s crucial to remember that this analysis is for informational purposes only and should not be considered financial advice. Always conduct your own thorough research and consult with a financial advisor before making any investment decisions.
Actionable Insights: What Can You Do With This Information?
So, how can you leverage this Ethereum on-chain analysis in your crypto strategy?
- Monitor On-Chain Metrics: Keep an eye on key on-chain indicators like CBD, exchange flows, and active addresses to stay informed about market trends. Platforms like Glassnode, Nansen, and Santiment offer valuable on-chain data and analytics.
- Dollar-Cost Averaging (DCA): If you believe Ethereum is undervalued and the data suggests a potential bottom, consider employing a dollar-cost averaging strategy to gradually accumulate ETH over time.
- Further Research: Dive deeper into Glassnode’s reports and explore other on-chain metrics to build a more comprehensive understanding of the market dynamics.
- Stay Informed: Keep abreast of broader market news and developments that could impact Ethereum’s price trajectory.
Conclusion: Hopeful Signs for Ethereum, But Proceed with Caution
Glassnode’s powerful on-chain data analysis offers a glimmer of hope for Ethereum enthusiasts. The rising Cost Basis Distribution and the Capitulation Metric are indeed suggestive of a potential short-term bottom. However, the cryptocurrency market remains volatile and unpredictable. While these signals are encouraging, it’s essential to remain vigilant, conduct thorough due diligence, and manage risk appropriately. Could this be the turning point for ETH? Only time will tell, but the on-chain signals are certainly worth paying attention to.


