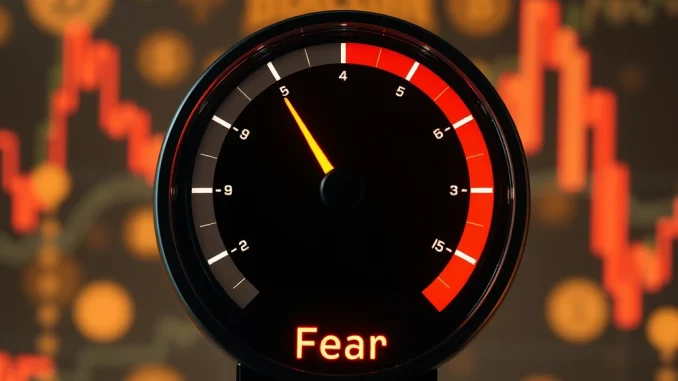
Crypto enthusiasts and investors are closely watching the latest reading from the **Crypto Fear & Greed Index**, which has recently taken a notable tumble. This popular indicator, designed to gauge overall **crypto market sentiment**, provides a snapshot of the emotional state driving the market. As of June 6, the index registered 45, a significant drop from the previous day’s 57. This 12-point slide has pushed the index out of the comfortable ‘Greed’ territory and firmly into the ‘Fear’ zone. But what exactly does this shift mean for assets like Bitcoin and the broader market?
Understanding the Crypto Fear & Greed Index
The **Crypto Fear & Greed Index**, provided by Alternative, serves as a barometer for market psychology. It operates on a simple premise: extreme fear often signals a potential buying opportunity, while extreme greed can indicate the market is due for a correction. The index is measured on a scale from 0 to 100:
- 0-24: Extreme Fear
- 25-49: Fear
- 50-74: Greed
- 75-100: Extreme Greed
A reading of 45 places the market squarely in the ‘Fear’ zone, suggesting that investors are becoming cautious or even panicky.
What Drives the Index?
The index isn’t based on a single factor but aggregates data from six different sources to provide a comprehensive view of **market fear** and sentiment. Each factor carries a specific weighting:
| Factor | Weighting | Explanation |
|---|---|---|
| Volatility | 25% | Measures current volatility and maximum drawdown of Bitcoin compared to average values. High volatility often indicates a fearful market. |
| Market Momentum/Volume | 25% | Compares current volume and market momentum (specifically for Bitcoin) with average values. High buying volume in a positive market indicates greed; high selling volume in a negative market indicates fear. |
| Social Media | 15% | Analyzes posts on social media platforms (primarily Twitter) for specific keywords and assesses the speed and frequency of mentions. High engagement and positive sentiment can indicate greed. |
| Surveys | 15% | (Currently paused) Gathers sentiment data from weekly polls, asking people how they see the market. |
| Bitcoin Dominance | 10% | Examines Bitcoin’s share of the total market cap. Rising dominance can signal fear as investors move away from altcoins into the relative safety of Bitcoin. Falling dominance can indicate greed as investors take on more risk with altcoins. |
| Google Trends | 10% | Analyzes search query data on Google for terms related to Bitcoin and cryptocurrencies. Rising search interest for terms like “Bitcoin price manipulation” or “crypto crash” indicates fear. |
The recent drop to 45 suggests that a combination of these factors – potentially increased volatility, negative market momentum, or a shift in social media sentiment and Google searches – has contributed to the overall decrease in confidence.
Entering the Crypto Fear Zone: What Does it Mean?
Moving into the **crypto fear zone** signifies a change in the prevailing market mood. When the index is in this range, investors are typically more risk-averse. They might be selling assets, hesitant to buy, or expecting prices to fall further. This sentiment can become a self-fulfilling prophecy, driving prices down as fear leads to selling pressure.
Historically, periods of ‘Fear’ or ‘Extreme Fear’ have sometimes presented opportunities for long-term investors who believe in the underlying technology and assets. As the famous saying goes, “Be fearful when others are greedy, and greedy when others are fearful.” However, it’s crucial to remember that the index is just one tool, and market conditions can change rapidly.
Considering the Bitcoin Price Impact
While the index considers the entire crypto market, Bitcoin’s influence is significant, given its dominance and role as the market leader. The **Bitcoin price impact** on the index is substantial, with volatility, momentum, and dominance factors heavily weighted towards BTC. A decline in the index often correlates with a stagnant or falling Bitcoin price, as cautious sentiment reduces buying pressure.
Conversely, if the index were to dip further into ‘Extreme Fear’, it might signal a potential bottoming out phase before a recovery, assuming other fundamental factors remain strong. Investors often look to these sentiment indicators alongside price charts and on-chain data to make informed decisions.
Gauging Crypto Market Sentiment Beyond the Index
While the **crypto market sentiment** captured by the Fear & Greed Index is valuable, it’s not the only indicator. Traders and analysts also look at:
- Trading volumes across exchanges
- Funding rates in perpetual futures markets
- Social media trends beyond just mentions
- On-chain data like exchange flows and whale activity
Combining the insights from the Fear & Greed Index with these other metrics can provide a more complete picture of the market’s emotional state and potential direction.
Conclusion: Navigating Fear in the Market
The drop in the **Crypto Fear & Greed Index** to 45 and the entry into the ‘Fear’ zone highlight a clear shift in **crypto market sentiment**. While this might signal increased caution and potential downward price pressure, particularly impacting the **Bitcoin price impact**, it also serves as a reminder that market cycles involve swings between fear and greed. Understanding what the index measures and considering the historical context of the **crypto fear zone** can help investors navigate these volatile periods. As always, the index is a guide, not a crystal ball, and should be used as part of a broader analysis before making investment decisions in the crypto market.


