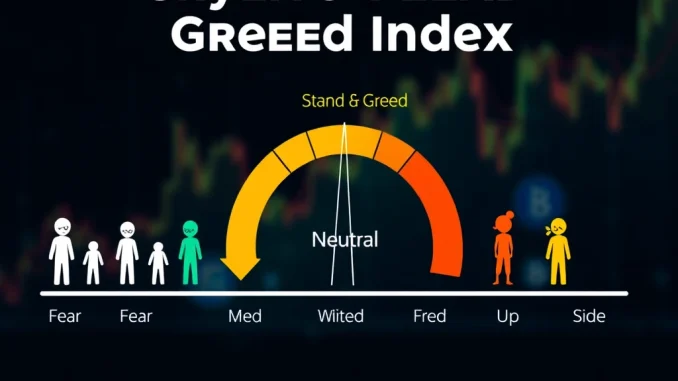
Have you been watching the charts lately? The **Crypto Fear & Greed Index**, a popular tool for gauging market sentiment, has just made a notable move. As of June 20, this index, provided by Alternative, registered a value of 54. This represents a three-point decrease from the previous day and, crucially, signals a shift out of the ‘Greed’ zone and into the ‘Neutral’ territory. This change in **market sentiment** is something many crypto participants pay close attention to.
What is the Crypto Fear & Greed Index?
The Crypto Fear & Greed Index is designed to quantify the prevailing emotions in the cryptocurrency market. Extreme fear often suggests investors are overly worried, which *could* present a buying opportunity for those brave enough. Conversely, extreme greed might indicate the market is due for a correction, as investors could be getting ahead of themselves.
The index operates on a scale from 0 to 100:
- 0-24: Extreme Fear
- 25-49: Fear
- 50-59: Neutral
- 60-74: Greed
- 75-100: Extreme Greed
Entering the **neutral zone crypto** indicates a state where the market isn’t dominated by overwhelming bullishness or bearishness. It suggests a period of balance, indecision, or perhaps a transition.
How is Market Sentiment Measured?
The index isn’t based on a single factor but aggregates data from several sources to provide a holistic view. Here’s a breakdown of the components (note: survey data is currently paused):
| Factor | Weighting | Description |
|---|---|---|
| Volatility | 25% | Measures the current volatility and maximum drawdowns of Bitcoin compared to average values. |
| Market Momentum / Volume | 25% | Analyzes the current volume and market momentum compared to average values. High buying volume in a positive market suggests greedy behavior. |
| Social Media | 15% | Scans Twitter for specific hashtags and analyzes the speed and quantity of posts, looking for sentiment indicators. |
| Surveys (Paused) | 15% | Weekly sentiment surveys were conducted, though this component is currently inactive. |
| Bitcoin Dominance | 10% | Measures Bitcoin’s share of the total market capitalization. An increasing dominance might signal fear, as investors potentially move from altcoins to Bitcoin, seen as safer. A decreasing dominance might suggest increasing altcoin speculation (greed). |
| Google Trends | 10% | Analyzes Google Search queries related to Bitcoin and other cryptocurrencies, looking at search volume and sentiment changes. |
The combination of these factors provides the final daily index value.
Why Did the Index Shift to Neutral?
The exact reasons for a specific point drop can be complex, but a shift from ‘Greed’ to ‘Neutral’ typically occurs due to:
- A slight pullback or consolidation in crypto prices.
- Decreased trading volume or momentum following a period of upward movement.
- A cooling off in positive social media chatter.
- Changes in **Bitcoin dominance**, perhaps a slight decrease or increase that shifts overall sentiment.
- General market uncertainty or a lack of strong bullish catalysts.
The three-point drop from 57 to 54 is relatively small but enough to cross the threshold into the 50-59 ‘Neutral’ range.
Can the Index Guide Your Investing Strategy?
While the Crypto Fear & Greed Index is a valuable tool for understanding prevailing **investing strategy** sentiment, it should not be the *only* factor in your decision-making. It’s a snapshot of market psychology, not a predictive model.
Potential Uses:
- Contra-Indicator: Some investors use it as a contra-indicator, following the famous quote often attributed to Warren Buffett: “Be fearful when others are greedy, and greedy when others are fearful.” A move to Extreme Greed might make them cautious, while a move to Extreme Fear might make them look for opportunities.
- Confirmation Tool: Others use it to confirm their own analysis. If the index shows Greed during a rally you suspect is overextended, it might reinforce your view.
- Market Awareness: Simply being aware of the dominant market emotion can help you understand potential reactions to news or price movements.
Limitations:
- It’s backward-looking to some extent, reflecting *current* sentiment based on recent data.
- It doesn’t account for fundamental analysis, technological developments, or regulatory news.
- The ‘Surveys’ component is paused, removing one data point.
- It’s heavily influenced by Bitcoin data due to its market dominance.
The Significance of the Neutral Zone
The ‘Neutral’ zone is often less dramatic than the extremes. It can represent a period of consolidation after a move, a pause before the next trend develops, or simply a balanced state where neither bulls nor bears have a strong upper hand. For traders, it might mean increased chop or range-bound price action. For long-term investors, it might be a period to observe and wait for clearer signals.
Conclusion: Staying Informed on Market Sentiment
The shift of the **Crypto Fear & Greed Index** to the ‘Neutral’ zone at 54 is a clear indicator that the market’s collective mood has cooled slightly from a state of ‘Greed’. While this index provides valuable insight into **market sentiment** by aggregating factors like volatility, momentum, social media, and **Bitcoin dominance**, it’s just one piece of the puzzle for developing a sound **investing strategy**. Use it as a tool to understand the prevailing psychology, but always combine it with your own research and analysis. The move to neutral doesn’t dictate future price action, but it does tell us that for now, extreme emotions have taken a backseat, leaving the market in a state of balance.


