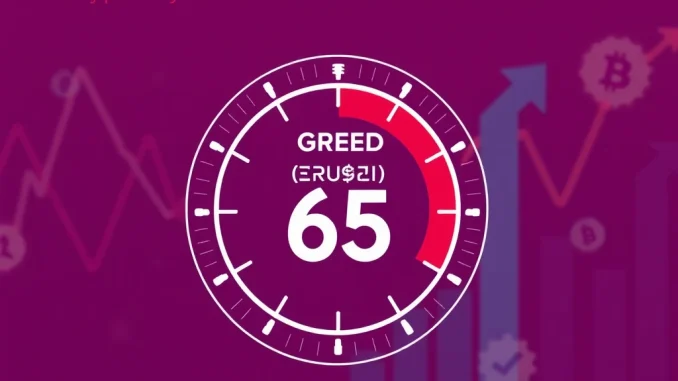
The pulse of the cryptocurrency market is often measured by more than just price charts. One widely watched indicator is the Crypto Fear & Greed Index. This index provides a snapshot of overall market sentiment, attempting to quantify the collective emotional state of crypto investors. As of May 3, the index, provided by Alternative, registered a reading of 65. This marks a slight decrease of two points from the previous day’s 67. Despite this minor dip, the index firmly remains within the ‘Greed’ zone. What does this *crucial* insight mean for current crypto market sentiment?
Understanding the Crypto Fear & Greed Index
At its core, the Crypto Fear & Greed Index is designed to give investors a sense of whether the market is driven by fear (potentially undervalued, buying opportunity) or greed (potentially overvalued, due for a correction). The index operates on a simple scale from 0 to 100:
- 0-24: Extreme Fear
- 25-49: Fear
- 50-50: Neutral
- 51-74: Greed
- 75-100: Extreme Greed
Historically, periods of ‘Extreme Fear’ have often coincided with market bottoms, presenting potential accumulation zones for brave investors. Conversely, readings in ‘Extreme Greed’ can signal that the market is overheating and potentially due for a pullback as irrational exuberance takes hold.
How is Crypto Market Sentiment Measured?
The index doesn’t rely on a single data point. Instead, it aggregates data from six different sources, each weighted differently to provide a comprehensive view of crypto market sentiment:

| Factor | Weighting | What it Measures |
|---|---|---|
| Volatility | 25% | Current volatility and maximum drawdown compared to average values. High volatility often indicates a fearful market. |
| Market Momentum/Volume | 25% | Current volume and market momentum compared to average values. High buying volume in a positive market suggests greed, while low volume or high selling volume suggests fear. |
| Social Media | 15% | Analyzes sentiment and engagement on social platforms (primarily Twitter) regarding specific coins. High levels of positive engagement or rapid growth in mentions can indicate greed. |
| Surveys | 15% | Weekly polls conducted by Alternative.me (currently paused) asking users about their market outlook. (Historically included). |
| Bitcoin Dominance | 10% | Measures Bitcoin’s share of the total crypto market cap. A rising Bitcoin dominance can indicate fear (investors moving to BTC as a perceived safe haven), while falling dominance can indicate greed (investors taking on more risk in altcoins). |
| Google Trends | 10% | Analyzes search queries related to Bitcoin and other cryptocurrencies. Searches for terms like “Bitcoin price prediction” might indicate greed, while searches like “Bitcoin crash” might indicate fear. |
Diving Deeper: The Factors Influencing the Index
Each component contributes uniquely to the final score. For instance, significant crypto volatility can quickly push the index towards ‘Fear’ if prices are dropping sharply, or contribute to ‘Greed’ if prices are surging rapidly with high volume. Similarly, tracking Bitcoin dominance offers insight into risk appetite; when investors are fearful, they often retreat to Bitcoin, increasing its dominance. When they are greedy, they spread capital into smaller, potentially higher-reward altcoins, decreasing BTC dominance. Google Trends acts as a gauge of public interest and the emotional nature of search queries related to the market.
What Does the Current ‘Greed’ Reading Tell Us?
A reading of 65 places the market firmly in the ‘Greed’ zone. This suggests that, on average, market participants are feeling confident and optimistic about the future price direction of cryptocurrencies. Capital is flowing, momentum is positive, and there’s a general willingness to buy. The two-point drop from 67 to 65 is minor and doesn’t signal a significant shift in sentiment yet. It could simply be day-to-day fluctuation or a slight cooling off after recent price movements. Remaining in the ‘Greed’ zone indicates that the bullish sentiment that has characterized the market recently is still largely intact.
Using the Index in Your Crypto Market Analysis
It’s crucial to remember that the Crypto Fear & Greed Index is a sentiment indicator, not a trading signal. It should be used as one tool among many in your overall crypto market analysis. High greed levels might serve as a cautionary flag, suggesting that the market could be getting ahead of itself and a correction might be more likely. Conversely, extreme fear could be an opportunity for long-term investors looking to buy assets at potentially discounted prices. Combining the index’s reading with technical analysis (chart patterns, indicators), fundamental analysis (project developments, news), and macroeconomic factors provides a more robust picture.
Limitations and Nuances of the Fear & Greed Index
While valuable, the index has limitations. It’s a broad measure and doesn’t distinguish between different cryptocurrencies. A high ‘Greed’ reading might be driven primarily by Bitcoin and Ethereum, while smaller altcoins lag behind, or vice versa. It’s also backward-looking to some extent, reacting to price movements and social trends that have already occurred. Sentiment can shift rapidly, especially in volatile markets, so the index is best viewed as a daily snapshot rather than a predictive forecast.
Summary: Navigating the Greed Zone
The Crypto Fear & Greed Index sitting at 65 confirms that positive crypto market sentiment currently prevails. While the slight dip is noted, it doesn’t alter the overall picture of a market characterized by confidence and buying interest. Understanding the factors like crypto volatility and Bitcoin dominance that influence the index provides a deeper understanding of market dynamics. Use this index as a crypto market analysis tool, not a definitive signal, and combine it with other research to make informed decisions in this exciting, yet unpredictable, market.


