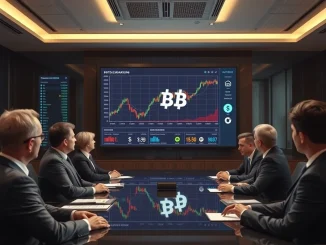
Cryptocurrency markets are constantly evolving. Investors often seek clarity amidst volatility. Recently, a significant alert has emerged regarding the future of BNB price. This news could impact many portfolios. According to a detailed analysis by CoinDesk, BNB, the native token of the Binance ecosystem, faces a potential 30% plunge. This sharp decline might occur if a specific technical indicator, the double top pattern, fully completes on its daily chart.
Understanding the Alarming Double Top Pattern and BNB Price Implications
The double top pattern is a bearish reversal formation. It typically signals a potential downturn after an asset has reached two distinct peaks at roughly the same price level. For BNB, this pattern has become particularly prominent. The token formed a peak around $1,350 last week. Crucially, it failed to break through this resistance level on two separate occasions. This repeated failure to surpass resistance is a key characteristic of the double top. It suggests a potential for a significant drop in value, potentially impacting the BNB outlook for the coming month. Traders often view this as a strong signal to prepare for a downward movement.
Historically, double top patterns have preceded substantial corrections in various financial markets. In the context of cryptocurrency, these patterns can be even more pronounced due to market volatility. The neckline for this specific BNB double top pattern is formed around the $1,100 level. Therefore, a daily candle closing decisively below this neckline would confirm the pattern’s completion. Such a move would activate the bearish target. This target, derived from the height of the pattern, projects a fall of approximately 30% from current levels. This would bring the price significantly lower. Consequently, many investors are watching this level closely.
Broader Market Sentiment and Binance Coin Pressures
The potential technical breakdown for BNB does not occur in isolation. Broader market sentiment and specific pressures on the Binance ecosystem are also contributing factors. The CoinDesk analysis specifically noted various negative rumors surrounding Binance. These rumors, whether substantiated or not, can significantly impact investor confidence. Furthermore, a substantial net outflow of $21.75 billion from the Binance platform over the past seven days adds to the concern. This outflow suggests that a significant amount of capital is leaving the exchange. Such movements can weaken Binance Coin‘s upward momentum. It makes the token more vulnerable to bearish technical signals. Traders and analysts consider these fundamental factors alongside technical charts. They often provide a more complete picture of an asset’s health.
A reduction in liquidity on the exchange, as indicated by outflows, can make it harder for BNB to sustain its price levels. It also increases the potential for rapid price movements. Negative news cycles can create a self-fulfilling prophecy. Investors might panic sell, further driving down prices. Therefore, the combination of technical weakness and fundamental concerns creates a challenging environment for BNB. Investors must remain vigilant. They should monitor both on-chain data and news developments.
Navigating the Volatility: A Cryptocurrency Analysis Perspective
For those engaged in cryptocurrency analysis, the current situation with BNB presents a complex scenario. Technical indicators like the double top pattern offer clear warning signs. However, the interplay with market fundamentals is equally crucial. Here are key points to consider:
- Confirmation Level: The $1,100 neckline is the critical level. A daily close below it is essential for pattern confirmation.
- Volume: Increased selling volume during the second peak and the break of the neckline would strengthen the bearish signal.
- Market Structure: Observe if lower lows and lower highs begin to form after the neckline break, indicating a new downtrend.
- External Factors: Monitor news related to Binance and broader crypto market trends. These can either exacerbate or mitigate the technical pattern.
Experienced traders often use stop-loss orders to manage risk in such situations. They also consider diversifying their portfolios. This helps mitigate the impact of a single asset’s decline. Understanding these elements is vital for making informed decisions. It helps protect investments in a volatile market. The current environment demands careful consideration.
What a Potential BNB Fall Means for Investors and the BNB Outlook
A 30% fall in BNB’s value would have significant implications for holders and the broader crypto market. For individual investors, this could mean substantial portfolio losses. Especially those heavily invested in Binance Coin. Furthermore, a sharp decline in BNB could impact the entire Binance ecosystem. This includes various projects built on the Binance Smart Chain. Therefore, the BNB outlook is not just about the token itself. It extends to the health and stability of one of the largest crypto platforms. This makes the current technical setup a point of concern for the entire crypto community.
Moreover, the ripple effect of a major token like BNB experiencing a significant drop could influence other altcoins. It might even affect the overall market sentiment. Traders often look at major tokens as bellwethers for the market’s health. A confirmed bearish pattern for BNB could therefore contribute to a more cautious or even fearful sentiment across the board. Thus, staying informed and adopting a risk-managed approach is paramount. This period of uncertainty calls for prudence and strategic planning.
In conclusion, the double top pattern forming on BNB’s daily chart is a critical development. It warrants close attention from all cryptocurrency participants. While technical analysis provides valuable insights, it is always essential to consider it alongside fundamental factors and broader market conditions. The coming weeks will be crucial in determining if BNB can avert this potential downturn or if the bearish pattern will play out as predicted by the analysis.
Frequently Asked Questions (FAQs)
What is a double top pattern in cryptocurrency analysis?
A double top pattern is a bearish technical indicator. It forms when an asset’s price reaches a high point, pulls back, and then rises to a similar high point again, failing to break above the previous resistance. This pattern suggests that buying pressure is exhausted, and a reversal to a downtrend is likely.
How significant is the potential 30% fall for BNB price?
A 30% fall is substantial for any asset, especially a major cryptocurrency like BNB. It would significantly impact investor portfolios and could signal broader weakness within the Binance ecosystem, potentially affecting other related tokens and projects.
What is the critical price level to watch for BNB’s double top pattern?
The critical price level, known as the neckline, for this specific BNB double top pattern is around $1,100. A daily candle closing below this level would confirm the pattern’s completion and activate the bearish price target.
Are there other factors contributing to BNB’s potential decline besides the technical pattern?
Yes, the CoinDesk analysis highlights negative rumors surrounding Binance and a significant net outflow of $21.75 billion from the platform over the past seven days. These fundamental factors can weaken investor confidence and exacerbate technical bearish signals, influencing the overall BNB outlook.
What should cryptocurrency investors do in response to this BNB outlook?
Investors should conduct their own research, consider risk management strategies like stop-loss orders, and diversify their portfolios. Monitoring both technical indicators and fundamental news related to Binance and the broader crypto market is crucial for making informed decisions.
Does this analysis guarantee a BNB price drop?
No, technical analysis provides probabilities, not guarantees. While a double top pattern is a strong bearish signal, market conditions can change rapidly. Unexpected positive news or a broader market recovery could invalidate the pattern. Investors should always consider multiple factors and exercise caution.