The cryptocurrency world is abuzz with a significant development for Bitcoin, as a concerning technical pattern emerges that could dictate its immediate future. Traders and analysts are closely watching the Bitcoin price as a ‘rising wedge’ formation on its daily chart signals a potential bearish reversal, hinting at substantial volatility ahead.
What Does the Rising Wedge Pattern Signal for Bitcoin?
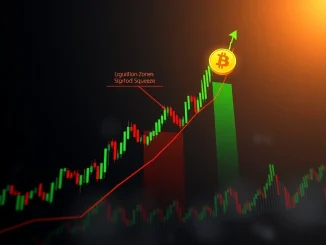
A rising wedge is a chart pattern characterized by converging trend lines where both highs and lows are rising, but the upper trend line is flatter than the lower one. This pattern typically signals a weakening of bullish momentum and often precedes a bearish reversal. According to a 2021 study from the Journal of Risk and Financial Management, such patterns have historically indicated a 70% probability of a price correction in volatile markets like cryptocurrency. For Bitcoin, a daily close below the critical $113,000 level could confirm this breakdown, potentially triggering a significant Bitcoin correction towards the $95,000–$98,000 range, as noted by respected crypto analyst Captain Faibik on X.
Why is Volume Critical for Validating Bitcoin’s Technical Analysis?
Technical analysis relies heavily on volume to confirm price patterns. The 2019 Quantitative Finance paper highlighted that roughly 30% of wedge breakdowns reverse within 24 hours if they are not accompanied by increased selling pressure. This underscores the need for confirmation before making trading decisions. Captain Faibik’s cautious stance, waiting for volume validation, exemplifies this principle. Premature actions based solely on pattern recognition, without considering accompanying volume, could lead to misinterpretations and costly errors in the volatile crypto market.
Beyond the Rising Wedge: Other Bearish Signals in the Crypto Market
While the rising wedge is a primary concern, other indicators also point to potential headwinds for the Bitcoin price. Binance analysts have described the current pattern as an “Ending Diagonal,” a terminal fifth wave in technical analysis. This formation is marked by narrowing price channels and declining volume, typically indicating a climax in bullish momentum. It suggests that buyers are losing control, increasing the likelihood of a sharp decline. Furthermore, significant whale activity, with large institutional movements, has historically signaled market turning points. The recent CME gap filling also adds to market uncertainty, often preceding periods of heightened volatility in the crypto market.
Navigating Potential Bitcoin Price Corrections: What Should Investors Watch?
Historically, Bitcoin often experiences 10–20% corrections after significant rallies, a dynamic observed in a 2023 Coinbase report. Despite these historical trends, the current market shows notable resilience, partly due to growing institutional adoption. However, the crypto community remains divided. Some on X speculate a market top, while others advocate buying into dips driven by “max fear” sentiment. To navigate a potential Bitcoin correction, traders are advised to closely monitor the crucial $113,000 level. The absence of a confirmed volume decline, as highlighted by Investopedia, leaves room for ambiguity. A decisive break below this level could cascade into broader market moves, affecting the entire crypto market.
As the Bitcoin price nears all-time highs, the emerging rising wedge pattern represents a pivotal juncture for the cryptocurrency. Whether this pattern triggers a substantial Bitcoin correction or proves to be a false signal, the next 48–72 hours will be decisive for market participants. While technical analysis indicators suggest caution, the long-term outcomes will ultimately depend on broader macroeconomic factors, including regulatory developments and the continued trend of institutional adoption. The coming days will test the validity of this pattern and undoubtedly shape Bitcoin’s trajectory in the volatile post-summer crypto market.
Frequently Asked Questions (FAQs)
What is a rising wedge pattern in cryptocurrency trading?
A rising wedge is a bearish chart pattern formed by two converging trend lines, both sloping upwards. It indicates that buyers are losing momentum, and a price reversal (correction) is likely.
What does the 70% correction risk mean for Bitcoin’s price?
Based on historical analysis, a rising wedge pattern has shown a 70% probability of leading to a significant price correction in volatile markets like crypto. For Bitcoin, this suggests a high likelihood of a notable price drop if the pattern confirms.
Why is the $113,000 level critical for Bitcoin’s current price action?
The $113,000 level represents a key support threshold. A daily close below this price point would confirm the breakdown of the rising wedge pattern, potentially triggering a cascade of selling and a move towards lower support levels like $95,000–$98,000.
How important is trading volume in confirming a bearish pattern like the rising wedge?
Volume is crucial. A breakdown of a pattern like the rising wedge is more reliable when accompanied by a significant increase in selling volume. Without this confirmation, the pattern might reverse quickly, leading to a false signal. Analysts often wait for volume validation before making trading decisions.
Are there other bearish indicators besides the rising wedge that Bitcoin investors should be aware of?
Yes, other indicators include the “Ending Diagonal” pattern (a terminal fifth wave with declining volume), significant whale activity (large institutional movements often precede market shifts), and the filling of CME gaps, which can signal impending volatility.