The cryptocurrency world is currently fixated on a pivotal moment for Bitcoin price. After a modest 0.2% weekly gain, the flagship digital asset finds itself at $118,456, poised to test a formidable liquidation wall near $121,100. This isn’t just another price point; it’s a critical threshold that could dictate Bitcoin’s trajectory in the coming weeks, stirring both anticipation and caution among traders.
Understanding the Bitcoin Price Crossroads: The $121K Liquidation Wall
Bitcoin’s journey often involves navigating invisible barriers, and the $121,100 mark has emerged as one such crucial ‘liquidation wall.’ This term refers to a price level where a significant volume of leveraged positions (both long and short) are at risk of automatic closure if the price reaches it. For Bitcoin, the concentration of $14.39 million in leverage at this point, as highlighted by data from Binance and Coinglass, signals intense market activity.
Here’s a quick look at the key figures shaping the current Bitcoin price narrative:
| Metric | Value | Significance |
|---|---|---|
| Current Price | $118,456 | Tight range, 0.2% weekly gain |
| Key Resistance | $120,222 | Crucial obstacle for upward momentum |
| Liquidation Wall | $121,100 | Key psychological & structural barrier |
| Liquidation Volume at $121K | $14.39 million | Concentration of leverage |
| Key Support | $117,697 | Critical floor, indicates buying interest |
Why is this level so important for the Bitcoin price?
- Catalyst for Rebound: If Bitcoin successfully pushes through this wall, it could absorb the outstanding liquidations, effectively clearing a path for further upward momentum as short positions are squeezed.
- Reinforcement of Downward Pressure: Conversely, a failure to breach this level, coupled with renewed selling pressure, could trigger cascading liquidations, pushing prices back towards established support zones.
This $121,100 level isn’t arbitrary; it’s a psychological and structural barrier. Trader Ali on Twitter emphasized its significance, noting that a sustained break above it could ease upward momentum, while a rejection could drag prices back. The market is watching closely to see if bulls have the strength to overcome this hurdle.
Decoding Crypto Liquidations: What the Data Reveals
Crypto liquidations provide a powerful lens into market sentiment and leverage activity. The liquidation heatmap offers a compelling narrative of Bitcoin’s journey from late January to July 2025.
Key Shifts in Liquidation Patterns:
- February Downturn: Total liquidations peaked at a staggering $565 million in late February. This period saw a sharp downturn, disproportionately impacting long positions. This indicates that many traders were betting on higher prices, only to be caught off guard by a sudden drop.
- July’s Short Squeeze: A significant shift occurred in July. Short liquidations surged, at times exceeding $200 million. This suggests that bearish traders, who were betting on a price decline, are now being forced to close their positions as Bitcoin stabilizes near the $120,000 mark. This ‘short squeeze’ phenomenon often precedes upward movements.
This divergence from earlier patterns is a critical indicator. The shift from long-heavy liquidations to short-dominant activity reflects evolving market sentiment. While traders were previously caught by downside risks, the current environment suggests a growing caution among bears and persistent buying interest from bulls.
Coinglass data further reinforces that liquidation concentrations cluster near major price thresholds. For instance, the area around $120,000 is a hotspot. A successful breakout here could set sights on $125,000, while a failure would likely result in renewed consolidation.
Navigating the Bitcoin Market Analysis: Support, Resistance, and Sentiment Shifts
Current Bitcoin market analysis highlights a well-defined trading range that has kept the asset oscillating. The established support level sits at $117,697, while resistance is found at $120,222.
The Tug-of-War:
- Support Resilience: The $117,697 support has proven remarkably steady, indicating strong buying interest at these lower levels. This resilience is crucial for maintaining a foundational bullish bias.
- Resistance as an Obstacle: The $120,222 resistance, however, remains a formidable obstacle. Its integrity is paramount for any sustained upward movement. Until this level is decisively breached, Bitcoin is likely to remain confined within its current range.
The market’s sideways movement, coupled with reduced volatility compared to earlier in the year, reflects a period of consolidation. This can be seen as either a calm before a storm or a prolonged period of indecision. The persistent buying interest near $120,000, despite the resistance, suggests accumulation by bulls who are patiently waiting for a breakout.
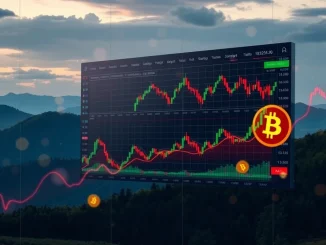
The Coinglass chart, illustrating BTC’s price and liquidation trends, reinforces this narrative: a steady price line around $118,000–$120,000 with liquidation volumes skewed toward short positions. This pattern could foreshadow a potential reversal if short-sellers continue to be squeezed.
What Does This Mean for BTC Price Prediction?
When considering BTC price prediction, the $121,100 liquidation wall becomes a central point of focus. Its outcome will significantly influence short-term forecasts.
Scenario 1: Bullish Breakout: If buying pressure intensifies and pushes Bitcoin above $121,100, absorbing the liquidation wall, we could see a rapid ascent towards the next major psychological and technical resistance levels, potentially targeting $125,000 or higher. This would signal a renewed bullish trend and validate the strength of the recent accumulation.
Scenario 2: Range-Bound Consolidation: Should Bitcoin fail to clear the $120,222 resistance and subsequently reject the $121,100 level, it is highly probable that the asset will remain within its current range of $117,000 to $120,000. This would mean continued sideways movement, with traders focusing on scalp opportunities rather than trend-following strategies. The $117,697 support would then become an even more critical floor.
Analysts caution that while the current momentum might subtly favor buyers due to the short-heavy liquidations, the absence of a decisive breakout means patience is key. The liquidation data provides insights into short-term volatility but doesn’t yet confirm a sustained trend.
Actionable Insights for Bitcoin Trading
For those engaged in Bitcoin trading, understanding these dynamics is paramount. The current market presents both opportunities and risks, demanding a strategic approach.
Key Considerations for Traders:
- Monitor the $121,100 Level: This is the immediate battleground. A strong candle close above it on higher timeframes (e.g., 4-hour or daily) would be a bullish signal.
- Watch Support and Resistance: The $117,697 support and $120,222 resistance define the current boundaries. Trading within this range, or waiting for a clear break, are viable strategies.
- Leverage Caution: The concentration of liquidations underscores the inherent risks of high leverage, especially around key price points. Prudent risk management is essential.
- Volume Confirmation: Any significant price movement, especially a breakout, should ideally be accompanied by increased trading volume to confirm its sustainability.
- Sentiment Shift: Pay attention to how the market reacts if the $121,100 wall is tested. A strong rejection could signal renewed bearish sentiment, while a breakthrough could ignite fresh bullish momentum.
The shift from long-heavy to short-heavy liquidations indicates a change in the market’s vulnerability. Short-sellers are increasingly exposed, which could fuel a squeeze if bulls apply enough pressure. However, until that pressure results in a decisive break, the market remains in a state of delicate balance.
Conclusion
Bitcoin stands at a pivotal juncture, with the $121,100 liquidation wall representing a crucial test for its immediate future. While the 0.2% weekly gain reflects a tight trading range, the underlying liquidation data reveals a fascinating shift: short-sellers are increasingly vulnerable, hinting at potential bullish momentum. The interplay between the $117,697 support and $120,222 resistance defines the current battlefield. Whether Bitcoin absorbs this formidable wall and embarks on a new upward phase or retreats into further consolidation remains to be seen. Traders and investors alike must remain vigilant, as the outcome of this key test will undoubtedly shape the next chapter for the world’s leading cryptocurrency. The market awaits a decisive move, and all eyes are on the $121K threshold.
Frequently Asked Questions (FAQs)
- What is a “liquidation wall” in crypto trading?
A liquidation wall refers to a specific price level where a significant number of leveraged trading positions (both long and short) are concentrated and would be automatically closed, or “liquidated,” if the price reaches that point. These walls can act as strong support or resistance levels. - Why is the $121,100 level important for Bitcoin?
The $121,100 level is crucial because it represents a high concentration of leveraged positions ($14.39 million) that would be liquidated if Bitcoin reaches it. Successfully breaching this level could absorb these liquidations and clear the path for upward momentum, while a failure could lead to renewed selling pressure. - How have crypto liquidation patterns changed recently?
Earlier in the year (e.g., February), liquidations were predominantly long positions, indicating traders were caught by sharp price drops. More recently (e.g., July), short liquidations have surged, suggesting bearish traders are being squeezed as Bitcoin stabilizes, potentially signaling growing bullish momentum. - What are Bitcoin’s key support and resistance levels currently?
Bitcoin is currently trading within a tight range, with key support at $117,697 and significant resistance at $120,222. The integrity of these levels will determine whether Bitcoin consolidates further or attempts a breakout. - Does the current liquidation data indicate a clear trend for Bitcoin?
While the shift towards short-heavy liquidations suggests some bullish undertones, analysts caution that the data primarily indicates short-term volatility. It does not yet provide a clear signal for a sustained trend until Bitcoin decisively breaks above key resistance levels like $120,222 and the $121,100 liquidation wall. - What should traders watch for next?
Traders should closely monitor the $121,100 level for a decisive breakout or rejection. They should also observe trading volume accompanying any price moves, and continue to pay attention to the established support at $117,697 and resistance at $120,222. Prudent risk management is always advised.