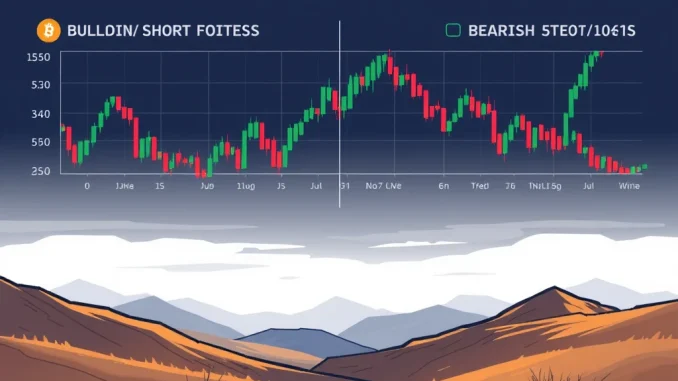
In the fast-paced world of cryptocurrency trading, understanding market sentiment is absolutely crucial, especially when dealing with derivatives like BTC perpetual futures. These instruments allow traders to speculate on the future price of Bitcoin without owning the underlying asset, making them popular but also subject to rapid shifts in positioning. One key metric traders watch is the long-short ratio, which provides insight into whether market participants are leaning bullish (long) or bearish (short) on Bitcoin.
What is the Bitcoin Long Short Ratio?
The Bitcoin long short ratio is a simple yet powerful indicator derived from futures trading data. It represents the proportion of long positions versus short positions held by traders on a specific exchange or across multiple exchanges. Essentially:
- A ‘long’ position profits when the price of Bitcoin goes up.
- A ‘short’ position profits when the price of Bitcoin goes down.
- The ratio is calculated by dividing the total volume or number of long positions by the total volume or number of short positions.
A ratio above 1 suggests more traders are positioned long than short, indicating a generally bullish sentiment among futures traders. A ratio below 1 suggests more traders are short, pointing to bearish sentiment. A ratio close to 1 indicates a relatively balanced market.
Analyzing Recent Crypto Long Short Data for BTC Perpetual Futures
Let’s dive into the recent crypto long short data for BTC perpetual futures across several prominent exchanges over the past 24 hours. This snapshot gives us a look at how traders were positioned during this specific period.
Here are the figures:
| Exchange/Total | Long Ratio | Short Ratio |
|---|---|---|
| Total (Across Tracked Exchanges) | 50.88% | 49.12% |
| Binance | 51.45% | 48.55% |
| Bybit | 50.27% | 49.73% |
| Gate.io | 51.11% | 48.89% |
Looking at the overall data, we see a slight tilt towards long positions, with longs making up just over 50% of the total. This indicates a marginally bullish sentiment across these platforms combined.
Implications of This Crypto Long Short Data
What can we infer from this specific set of numbers? The overall ratio being very close to 50/50 suggests a market that is relatively balanced in terms of positioning over the last 24 hours. While longs hold a slight edge, it’s not a dominant majority, which might imply caution or indecision among traders at this time.
Examining individual exchanges reveals minor variations:
- Binance shows the strongest lean towards longs among the top three listed, though still relatively close to 50/50.
- Bybit is the most balanced, with longs only slightly outpacing shorts.
- Gate.io also shows a modest preference for long positions.
These slight differences between exchanges can sometimes highlight platform-specific trading behaviors or dominant trader demographics, though in this instance, the sentiment appears quite uniform across the board – slightly bullish, but not overwhelmingly so.
Using This Data in Your Futures Trading Strategy
How can you incorporate the Bitcoin long short ratio into your futures trading strategy? This data point is best used as one tool among many for market sentiment analysis. Here are a few ways traders might consider it:
- Sentiment Confirmation: If other indicators (like price action, volume, or technical analysis patterns) suggest a potential upward move, a long-short ratio leaning towards longs might confirm that sentiment among futures traders.
- Contrarian Signal: Some traders use extreme long-short ratios as contrarian indicators. For example, if the ratio shows an *overwhelming* majority of traders are long, they might anticipate a potential short squeeze or price reversal as too many positions are crowded on one side. However, the current data does not show such an extreme.
- Risk Management: Understanding the general positioning can help you gauge potential market reactions. If the market is heavily skewed one way, a sudden price move against that bias can trigger cascades of liquidations, leading to sharp price swings.
Remember, no single indicator tells the whole story. This ratio is a snapshot of past positioning and doesn’t predict future price movements with certainty.
Market Sentiment Analysis: Beyond the Ratio
While the long-short ratio provides valuable crypto long short data, a comprehensive market sentiment analysis requires looking at other factors as well. Consider:
- Funding Rates: Positive funding rates for BTC perpetual futures often indicate that longs are paying shorts, another sign of bullish sentiment (as demand for long positions is higher). Negative rates suggest the opposite.
- Open Interest: This shows the total number of outstanding futures contracts. Rising open interest alongside rising prices can indicate strong bullish momentum, while rising open interest with falling prices might suggest increasing shorting activity.
- Volume: High trading volume validates price movements and sentiment indicators.
- News and Events: Geopolitical events, regulatory news, and major industry developments significantly impact trader sentiment and positioning.
Combining the long-short ratio with these other data points provides a much richer picture of the market’s mood and potential direction.
Conclusion
The latest 24-hour Bitcoin long short ratio for BTC perpetual futures shows a market leaning slightly long but remaining relatively balanced overall. While this specific crypto long short data point on its own doesn’t signal a strong directional bias, it serves as a valuable piece of the puzzle for traders performing market sentiment analysis. Integrating this data with other indicators is key to developing a robust futures trading strategy. Always remember that past positioning is not a guarantee of future price action, and risk management is paramount in futures trading.


