Explodes: Unpacking its Bullish 24-Hour Surge")
Are you tracking the pulse of the crypto market? Bitcoin Cash (BCHUSDT) just delivered an electrifying performance, showing significant strength and breaking key resistance levels. This detailed market overview dives deep into the factors behind BCHUSDT‘s impressive 24-hour surge, providing crucial insights for every crypto enthusiast.
Bitcoin Cash (BCHUSDT) Takes Flight: The 24-Hour Breakthrough
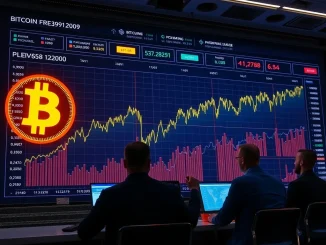
Over the past 24 hours, Bitcoin Cash (BCHUSDT) has captured significant attention, advancing an impressive 8.6%. This strong upward movement signals a robust bullish continuation pattern, captivating traders and investors alike in the broader crypto market analysis. The price successfully breached a critical resistance level at $560.0, a move that was powerfully supported by a surge in trading volume during the final 15-minute candle of the period. This breakout is a testament to the growing buying pressure for BCH.
Looking at the numbers, Bitcoin Cash (BCHUSDT) commenced its 24-hour cycle on July 26, 2025, at 12:00 ET, opening at $555.8. By the close on July 27, 2025, 12:00 ET, it had reached $598.6. The day saw a high of $595.0 and a low of $552.5, demonstrating a clear upward trajectory. The total volume traded during this period was a substantial 59,359.18 BCH, translating to a notional turnover of approximately $34.6 million. This significant turnover underscores the substantial market participation driving this rally.
Unpacking the Bullish BCH Price Action
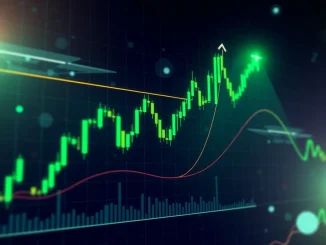
The recent surge in BCH price wasn’t a random event; it was underpinned by distinct technical formations and strategic price movements. A clear bullish continuation pattern emerged after the decisive break above the $560.0 resistance. This pivotal moment was further validated by a large bullish engulfing pattern observed at the $559.0–$560.0 range around 00:15 ET, signaling a definitive shift in market momentum towards the bulls.
Key aspects of this price action include:
- Resistance Break: The $560.0 level, once a formidable barrier, was convincingly surpassed.
- Support Hold: A crucial support level at $555.0 briefly held its ground before the rally intensified, preventing a downturn and reinforcing the bullish sentiment.
- Descending Triangle Resolution: On the 15-minute chart, a descending triangle pattern, typically bearish, surprisingly resolved to the upside. This breakout was confirmed by robust volume, indicating strong buyer conviction overriding previous bearish pressures.
These structural developments paint a clear picture of sustained buying interest and a determined push higher for Bitcoin Cash.
Decoding BCH Technical Indicators: RSI, MACD, and Bollinger Bands
Understanding the underlying BCH technical indicators provides deeper insight into the current strength and potential future movements of Bitcoin Cash.
- Relative Strength Index (RSI): The RSI reached 70.0 by 10:45 ET, pushing into overbought territory. While this often suggests a short-term pullback might be imminent, the ongoing divergence between price and RSI indicates that buyers maintain strong control. This suggests that any potential dip could be a fresh buying opportunity rather than a reversal.
- Moving Average Convergence Divergence (MACD): The MACD histogram turned sharply positive after 06:00 ET, accompanied by a bullish crossover and expanding divergence. This strong MACD signal reinforces the bullish momentum, indicating increasing buying pressure and a clear upward trend.
- Bollinger Bands: Volatility expanded notably after 06:00 ET, with the Bollinger Bands widening significantly. The upper band reached $595.0, and the lower band was at $558.0. The price closing near the upper band is a strong signal for continued bullish momentum. The widening bands suggest heightened market participation and potential for further gains, although a period of consolidation might follow this rapid expansion.
These indicators collectively confirm the robust nature of the current rally and provide valuable cues for traders.
Volume & Turnover: Fueling the Bitcoin Cash Rally
The sheer force of the Bitcoin Cash rally can be largely attributed to significant increases in volume and turnover. These metrics are crucial for validating price movements, distinguishing genuine market conviction from mere speculative noise.
- Volume Spikes: A dramatic spike in volume was observed after 06:15 ET. A single 15-minute candle at that time recorded an astounding 16,438.045 BCH traded, representing a notional turnover of approximately $9.4 million. This particular surge highlights a period of intense buying activity.
- Sustained Conviction: The final 15-minute candle of the 24-hour period further underscored the market’s conviction, with 8,003 BCH traded at $598.6. This sustained high volume into the close suggests that buyers were not just taking profits but were actively pushing the price higher with confidence.
The tandem movement of price and turnover provides strong evidence of genuine buying pressure, rather than manipulative wash trading, reinforcing the legitimacy of BCH’s ascent.
Navigating the Bitcoin Cash Outlook: What’s Next?
With Bitcoin Cash in a strong short-term bullish phase, what does the immediate future hold? Understanding key Fibonacci retracement levels can provide insights into potential support and resistance zones, crucial for forming a comprehensive Bitcoin Cash outlook.
- Fibonacci Retracements:
- The 61.8% Fibonacci level on the 15-minute chart, located at $567.0, served as a minor support before the price’s rapid ascent.
- On the daily chart, the 38.2% retracement level of the recent bearish swing, at $563.0, was decisively broken to the upside, signaling a significant shift in trend.
- The next critical Fibonacci level to monitor is the 78.6% retracement, positioned at $590.0. A sustained break above this level could pave the way for further significant gains.
While the overall trend for Bitcoin Cash remains robustly bullish, the overbought RSI and recent price highs suggest that a period of consolidation or a minor pullback might occur. Investors should keenly watch for a potential test of the psychological $600.0 level in the next 24 hours. However, it’s prudent to be mindful of the risk of profit-taking, especially if the rally lacks continued follow-through. Maintaining vigilance and adapting to market signals will be key for navigating this exciting phase for BCH.
In summary, Bitcoin Cash (BCHUSDT) has demonstrated exceptional strength over the last 24 hours, driven by a powerful bullish continuation pattern, a decisive break of key resistance, and robust volume. Technical indicators like MACD strongly support the upward momentum, even as RSI signals overbought conditions, suggesting potential for a healthy consolidation. The impressive surge underscores genuine buying interest and positions BCH for further observation. As it approaches the $600.0 mark, the coming hours will reveal whether this momentum sustains or if profit-taking ensues. For traders and investors, monitoring these levels and market dynamics will be crucial.
Frequently Asked Questions (FAQs)
- What was the key resistance level broken by Bitcoin Cash (BCHUSDT)?
Bitcoin Cash (BCHUSDT) decisively broke above a key resistance level at $560.0, signaling a strong bullish continuation. - How did volume contribute to BCH’s recent price surge?
Volume spiked dramatically after 06:15 ET, with significant trading activity on key candles, indicating strong buying pressure and genuine market conviction, rather than wash trading, which directly impacted the BCH price. - What do the RSI and MACD indicators suggest for BCH?
The RSI reached overbought territory (70.0), suggesting potential for short-term caution or a pullback. However, the MACD showed a strong positive divergence and bullish crossover, confirming robust upward momentum. These are crucial BCH technical indicators. - What is the significance of the $600.0 level for Bitcoin Cash?
The $600.0 level is a key psychological resistance. A sustained break above it could indicate further gains, while a failure to hold could lead to consolidation or profit-taking, influencing the short-term Bitcoin Cash outlook. - Was there any specific chart pattern that influenced the BCH rally?
Yes, Bitcoin Cash formed a strong bullish continuation pattern after breaking resistance, and a descending triangle on the 15-minute chart surprisingly resolved to the upside, confirmed by volume.