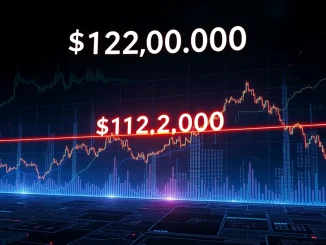
Are you ready for a potential seismic shift in the crypto world? All eyes are on the Bitcoin price as it carves out a powerful bull flag pattern, signaling a potential charge towards an astounding new all-time high of $123,182. This isn’t just speculation; it’s a meticulously formed technical setup that has traders and analysts buzzing. After an impressive 11.1% surge from its July support base, Bitcoin is now positioned for a monumental move. Let’s dive deep into what’s driving this optimism and what it could mean for your portfolio.
Understanding the Bitcoin Bull Flag Pattern: A Path to Higher Prices?
At the heart of Bitcoin’s current bullish momentum lies the classic Bitcoin bull flag pattern. This formation is a strong continuation signal in technical analysis, typically appearing after a sharp price increase (the ‘flagpole’) followed by a period of consolidation within a descending channel (the ‘flag’). For Bitcoin, this pattern has developed following a significant breakout from a falling wedge in early June, with the cryptocurrency establishing a series of higher lows that converge towards the critical $120,000 level.
The consolidation phase near $119,947 has been key, acting as a spring for the next leg up. A breakout above the $120,000 threshold is identified as the crucial zone that could ignite the next phase of this rally. This level is not arbitrary; it represents a convergence of ascending support lines and prior resistance, making its breach particularly significant.
Decoding Bitcoin’s Technical Analysis: What the Charts Tell Us
Beyond the bull flag, a closer look at Bitcoin technical analysis reveals several compelling indicators supporting the upward trajectory. The price has shown remarkable organic growth, moving steadily from a local bottom of $91,000 in late June to nearly $120,000 by mid-July. This indicates steady accumulation by long-term holders rather than volatile, speculative spikes.
Key Technical Observations:
- Relative Strength Index (RSI): The 4-hour RSI stands at a healthy 59.66. This suggests ample room for upward momentum without indicating overbought conditions, which often precede pullbacks. Crucially, there’s an absence of bearish divergence, reinforcing the likelihood of sustained buying pressure.
- Volume Trends: While supportive of the rally, trading volumes have yet to peak. This implies that the current move still has fuel, and a significant volume surge could accompany the breakout to new highs.
- Fibonacci Retracement: Bitcoin has already cleared the 50% Fibonacci retracement level at $115,722, a strong sign of underlying strength and a successful retest of a key support zone.
- Macro Support: The green macro support trendline from March continues to reinforce the bullish case, providing a robust foundation for Bitcoin’s ascent.
The chart structure currently shows no exhaustion signals, further bolstering the confidence of traders looking for continued gains. This consistent upward movement, without signs of buyers tiring, paints a very optimistic picture for the immediate future of the Bitcoin price.
Is a New Bitcoin ATH Imminent? Targeting $123,182
The ultimate prize in this bullish narrative is the retest, and potential breach, of Bitcoin’s all-time high of $123,182. With Bitcoin currently trading within 3% of its ATH, the tension in the market is palpable. The $120,000 level, affectionately dubbed the ‘G-Spot’ by on-chain commentator TommyJR, is the immediate focus. Holding above this threshold is seen as a strong signal for continued strength and a springboard towards the ATH.
What Needs to Happen for a New Bitcoin ATH?
For Bitcoin to truly enter a new phase of price discovery, securing a stable close above $120,000 is paramount. This would confirm the breakout and likely trigger a fresh wave of buying interest, potentially eliminating visible resistance levels and paving the way for unprecedented gains. Traders are closely monitoring prior all-time highs as the ultimate breakout signal, anticipating that once this barrier is overcome, the path could be clear for a significant upward move.
Navigating the Current Crypto Market Analysis: Opportunities and Cautions
The broader crypto market analysis shows building confidence, driven largely by Bitcoin’s strong performance. As the leading cryptocurrency, Bitcoin often sets the tone for the entire digital asset space. Its current bullish structure could pull altcoins higher, creating a positive feedback loop across the market.
However, it’s crucial to approach the market with a balanced perspective. While the indicators are overwhelmingly bullish, analysts caution that a pullback remains possible if the critical $120,000 level fails to hold. Market volatility is inherent to cryptocurrencies, and unexpected news or macroeconomic shifts can always influence price action. Traders should remain vigilant and consider risk management strategies, such as setting stop-loss orders, especially when approaching significant resistance levels.
Actionable Insights for Traders and Investors
For those looking to capitalize on Bitcoin’s potential surge, here are some key takeaways:
- Monitor the $120,000 Level: A stable close above this price point is a strong confirmation signal for continued upside.
- Watch for Volume: A significant increase in buying volume accompanying the breakout would add further conviction to the rally.
- Keep an Eye on RSI: While currently healthy, a move into deeply overbought territory (above 70-80) could signal a temporary pause or consolidation.
- Risk Management: Despite the bullish outlook, always trade with a clear strategy and manage your risk exposure.
Conclusion: Bitcoin’s Bullish Horizon
The formation of the Bitcoin bull flag pattern, coupled with robust technical indicators and sustained buying pressure, paints a compelling picture for the cryptocurrency’s future. With the $123,182 all-time high firmly in its sights, Bitcoin appears poised for an exciting new chapter of price discovery. While caution is always warranted in volatile markets, the current confluence of positive signals suggests that the journey towards a new Bitcoin ATH could be just around the corner, potentially redefining the landscape of the entire crypto market. Keep watching those charts!
Frequently Asked Questions (FAQs)
What is a Bitcoin Bull Flag pattern?
A Bitcoin Bull Flag is a bullish continuation pattern that forms after a strong upward price movement (the ‘pole’), followed by a period of consolidation within a downward-sloping channel (the ‘flag’). A breakout above the flag’s upper trendline signals a continuation of the prior uptrend, often targeting a price equivalent to the flagpole’s height.
Why is the $120,000 level important for Bitcoin’s price?
The $120,000 level is crucial because it acts as a convergence point for multiple technical indicators, including ascending support lines and prior resistance. A stable close above this level is considered a strong confirmation of bullish momentum and a potential trigger for a push towards Bitcoin’s all-time high.
What does the RSI of 59.66 indicate for Bitcoin?
An RSI of 59.66 on the 4-hour chart suggests that Bitcoin is in a healthy uptrend with room for further gains. It indicates strong buying interest without being in the overbought territory (typically above 70), which often precedes a price correction. This supports sustained upward momentum.
Is a new Bitcoin All-Time High (ATH) guaranteed?
While technical indicators and patterns like the bull flag suggest a high probability of a new Bitcoin ATH, nothing is guaranteed in financial markets. A pullback is still possible if key support levels, particularly $120,000, fail to hold. Traders should always conduct their own research and manage risk.
How can I stay updated on Bitcoin’s price movements?
To stay updated on Bitcoin’s price movements, you can follow reputable cryptocurrency news outlets, use real-time charting platforms, join crypto communities, and follow expert technical analysts on social media. Always cross-reference information from multiple sources.