Warning: Attempt to read property "post_excerpt" on null in /www/wwwroot/coinpulsehq.com/wp-content/themes/mh-magazine/includes/mh-custom-functions.php on line 392
Warning: Trying to access array offset on false in /www/wwwroot/coinpulsehq.com/wp-content/themes/mh-magazine/includes/mh-custom-functions.php on line 394
Warning: Attempt to read property "post_title" on null in /www/wwwroot/coinpulsehq.com/wp-content/themes/mh-magazine/includes/mh-custom-functions.php on line 394
Talks of an altcoin season have been put to rest after the total crypto market cap briefly slipped below $2 trillion. The decline resulted from a broader price crash in which many altcoins reached extremely low values that had not appeared in weeks, some months, and others— years.
Despite the steep correction, a few cryptocurrencies posted gains in the first week of July. Here are the top five.
MultiversX (EGLD) Bulls Show Resilience
MultiversX (EGLD), the native token of the new Internet economy blockchain, registered a 1.5% increase in the last seven days. However, the last 24 hours have been better as the price climbed by 7.15%% while trading at $31.42.
Earlier in the week, EGLD’s price increased to $32.18. But on July 3, the price fell to $29.43. Eventually, bulls could not defend the support, falling to $27.87.
However, the 4-hour showed that bulls mounted support around $27 to prevent a further fall. As a result, a bullish engulfing candle appears on the chart, leading the token value higher.
In addition, the token’s price is above the 20 EMA (blue) and 50 EMA (yellow). EMA stands for Exponential Moving Average and measures price changes over a period of time.
Read More: What Is Altcoin Season? A Comprehensive Guide
If the price is below the short-term EMAs, the trend is bearish. However, since it is above the indicators, it means that EGLD may continue to jump.
In addition, if this happens, the token will revisit its weekly high of $32.18. However, invalidation may occur if the market correction worsens.
MANTRA (OM) Triumphant After Tokenization Deal
Second on the list of altcoin gainers is MANTRA (OM). MANTRA is a layer-1 blockchain focused on the security of Real-World Assets (RWAs).
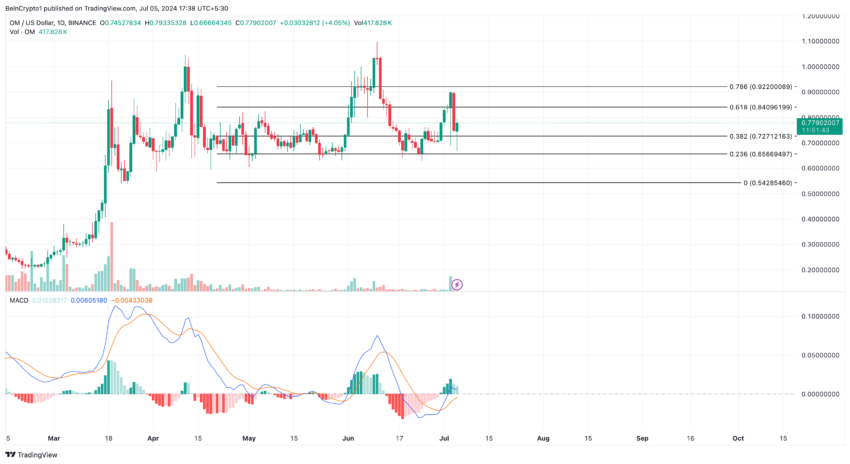
This week, OM’s price increased by 11%, trading at $0.78 at press time. Initially, the token’s price jumped to $0.89 after the project concluded a $500 million tokenization deal.
Afterward, the value declined to $0.74 before the recent revival. According to the OM/USD daily chart, the Moving Average Convergence Divergence (MACD) is positive.
As a key technical indicator, the MACD helps traders spot trend reversals by comparing the difference between the 26-day EMA (orange) and the 12-day EMA (blue). If the reading is positive, it implies that momentum is bullish and prices can increase.
The opposite happens when the MACD is negative. Since the reading is in the green zone, it implies that OM’s momentum is bullish. A look at the Fibonacci retracement indicator gives an idea of possible price targets.

From the chart above, OM can climb to $0.84, which is the 0.618 Fib level position. This will be the case if buying pressure increases. However, if things turn around, OM may retrace, possibly leading the price back to $0.72.
LayerZero (ZRO) Tops the Altcoin Gainers Table
LayerZero (ZRO) is a surprise entry into the top altcoin gainers of the first week. This is largely due to the controversy that rocked the token launch and airdrop distribution.
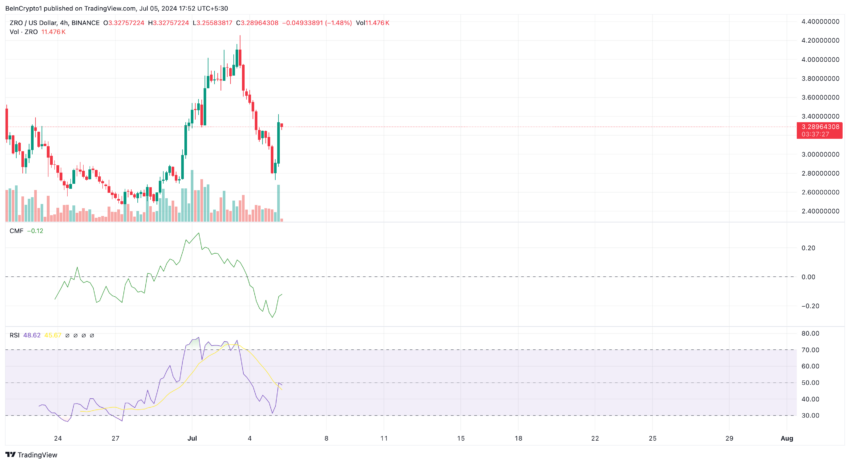
But none of the top 3 altcoin gainers comes close to ZRO. The token trades at $3.32, representing a 29.30% increase this week.
According to the 4-hour chart, ZRO was oversold on July 5. During this period, the Relative Strength Index (RSI), which measures momentum was below 30.00. The Chaikin Money Flow (CMF), which tracks accumulation and distribution, confirms the selling pressure at that time.
However, as of this writing, traders seem to be accumulating the token, as indicated by the CMF reading. The RSI is also on the cusp of jumping above the 50.00 neutral point.
Read More: Which Are the Best Altcoins to Invest in July 2024?

If this happens, coupled with a rise of the CMF into the positive region, ZRO’s price can reach $3.45 in the short term. However, the inability to reach the zones mentioned above may invalidate the prediction. Should this happen, ZRO may slip to $3.07.
Disclaimer
In line with the Trust Project guidelines, this price analysis article is for informational purposes only and should not be considered financial or investment advice. BeInCrypto is committed to accurate, unbiased reporting, but market conditions are subject to change without notice. Always conduct your own research and consult with a professional before making any financial decisions. Please note that our Terms and Conditions, Privacy Policy, and Disclaimers have been updated.
