Warning: Attempt to read property "post_excerpt" on null in /www/wwwroot/coinpulsehq.com/wp-content/themes/mh-magazine/includes/mh-custom-functions.php on line 392
Warning: Trying to access array offset on false in /www/wwwroot/coinpulsehq.com/wp-content/themes/mh-magazine/includes/mh-custom-functions.php on line 394
Warning: Attempt to read property "post_title" on null in /www/wwwroot/coinpulsehq.com/wp-content/themes/mh-magazine/includes/mh-custom-functions.php on line 394
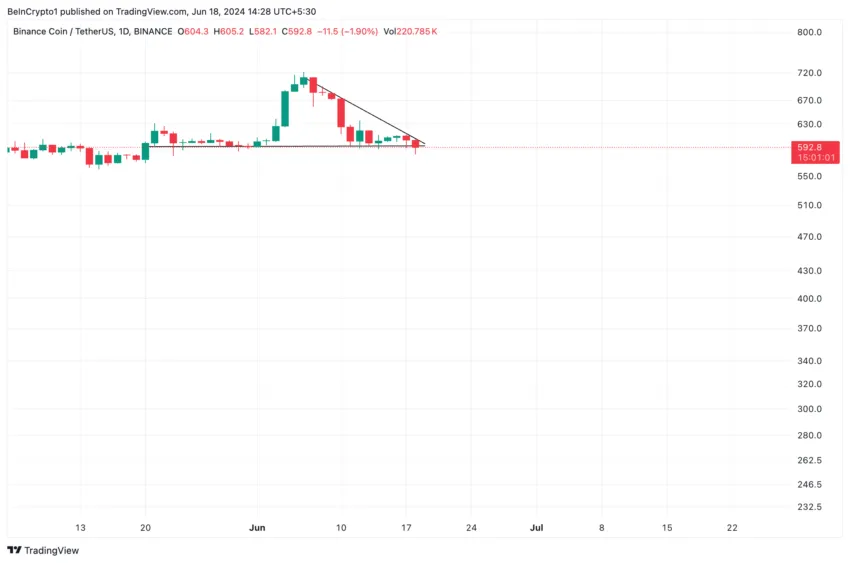
Binance Coin (BNB) climbed to an all-time high of $720.67 on June 6. As selling pressure intensified, the coin’s price declined and has since trended within a descending triangle.
As of this writing, BNB is trading at $592.71, having lost 18% of its value since June 6.
Binance Coin Loses the Support of the Bulls
Since June 6, when it rallied to its year-to-date high, BNB’s price has declined, forming a descending triangle.
This pattern is a bearish signal. It is formed when an asset’s price makes lower highs and bounces off a horizontal support level.
In BNB’s case, it has found support at $593.90, a level it currently trades under. Usually, when the bulls fail to defend the support level in a descending triangle, it signifies a bearish breakout and a continuation of the downtrend.
This means that the sellers have overpowered the buyers, and the asset’s price will continue to fall. Confirming the surge in BNB sell-offs, the coin’s price currently trades below its 20-day exponential moving average (EMA).
Read More: How To Buy BNB and Everything You Need To Know

An asset’s 20-day EMA tracks its average price over the past 20 days. When the price falls below this key moving average, it signals a decline in buying pressure and a rally in coin distribution.
BNB Price Prediction: Long Traders Maintain Bullish Outlook
BNB’s price decline in the past two weeks has led to a decrease in its futures open interest. On-chain data revealed that on June 8, the altcoin’s futures open interest skyrocketed to a year-to-date peak of $1.12 billion and has since dropped.
At press time, BNB’s futures open interest is $674 million, having decreased by 33% since June 8.

BNB’s futures open interest tracks the total number of outstanding futures contracts or positions that have not been closed or settled. When it falls, it suggests an uptick in the number of traders exiting the market without opening new positions.
However, despite BNB’s price fall in the last month, its funding rate across cryptocurrency exchanges has remained primarily positive. At press time, BNB’s funding rate is 0.0021%.
Funding rates are a mechanism used in perpetual futures contracts to ensure the contract price stays close to the spot price.
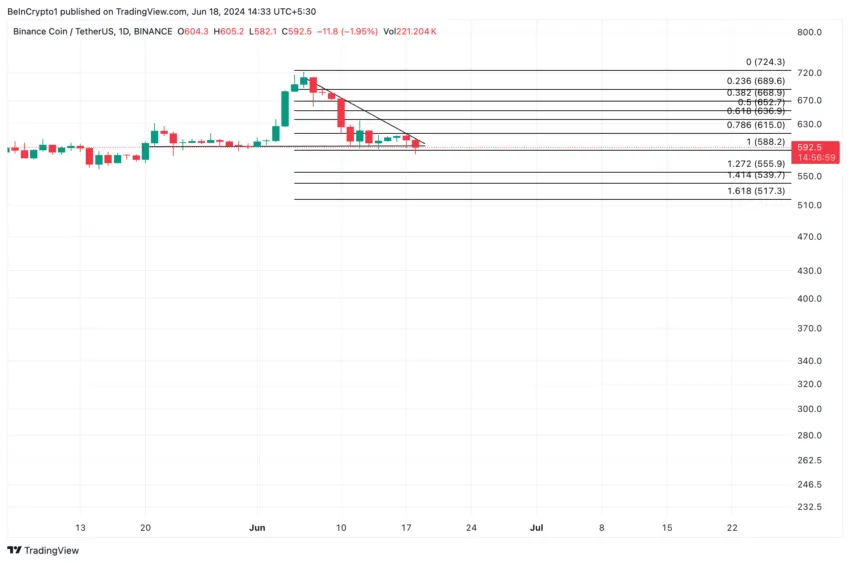
When an asset’s funding rate is positive, more traders hold long positions. This means that more traders expect the asset’s price to increase than those anticipating a price decrease. If selling activity wanes, BNB’s price may rally above $600 to exchange hands at $615.10.

However, if market sentiments continue to be bearish, it may push BNB’s price down toward $555.90.
Disclaimer
In line with the Trust Project guidelines, this price analysis article is for informational purposes only and should not be considered financial or investment advice. BeInCrypto is committed to accurate, unbiased reporting, but market conditions are subject to change without notice. Always conduct your own research and consult with a professional before making any financial decisions. Please note that our Terms and Conditions, Privacy Policy, and Disclaimers have been updated.
