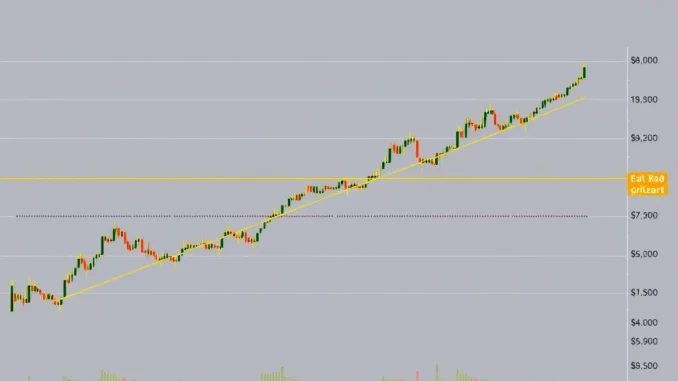
Excitement is building in the crypto market, particularly around Bitcoin. A significant technical event is on the horizon that has historically captured the attention of traders and analysts alike: the potential formation of a Golden Cross.
What is a Golden Cross in Technical Analysis?
For those tracking market movements, a Golden Cross is a key pattern within Technical Analysis. It occurs on a price chart when a short-term moving average crosses above a long-term moving average. The most commonly cited Golden Cross involves:
- The 50-day Simple Moving Average (SMA)
- Crossing above the 200-day Simple Moving Average (SMA)
This crossover is widely interpreted as a bullish signal, suggesting potential upward momentum for the asset’s price.
BTC Poised for Golden Cross Formation
According to Benjamin Cowen, the founder of Into The Cryptoverse, Bitcoin (BTC) is on the verge of forming this notable pattern. Sharing his analysis on X, Cowen indicated that the Golden Cross is likely to materialize within the next few days.
This forecast aligns with reports suggesting that BTC, which has seen significant price action, is anticipated to confirm the Golden Cross on its daily chart by the close of May.
Why Does the Golden Cross Matter? Historical Context
The significance of the Golden Cross lies in its track record as a potential precursor to market rallies. While not a guaranteed predictor, past instances have often coincided with periods of strong price appreciation for Bitcoin.
For example, previous Golden Cross formations have preceded notable price movements:
- A significant surge occurred in October 2023, where Bitcoin climbed around 45%, fueled in part by optimism surrounding potential spot ETF approvals.
- Another rally took place in late 2024, seeing BTC increase by roughly 60%, following the U.S. presidential election results.
These historical examples highlight why traders pay close attention when the 50-day Moving Average approaches or crosses the 200-day Moving Average.
What to Watch For Next
As the market anticipates this potential Golden Cross, traders and investors are closely monitoring Bitcoin’s price action and the movement of its key averages. The confirmation of this pattern could reinforce positive sentiment and potentially attract further buying interest, building on insights from Technical Analysis.
Summary: A Bullish Signal on the Horizon
In conclusion, the impending Golden Cross for Bitcoin is a significant technical development. This pattern, where the 50-day Moving Average crosses the 200-day Moving Average, is widely viewed as a bullish signal. While past performance is not indicative of future results, the historical correlation between Golden Crosses and price rallies makes this a key event for anyone following the BTC market and employing Technical Analysis strategies.


