Warning: Attempt to read property "post_excerpt" on null in /www/wwwroot/coinpulsehq.com/wp-content/themes/mh-magazine/includes/mh-custom-functions.php on line 392
Warning: Trying to access array offset on false in /www/wwwroot/coinpulsehq.com/wp-content/themes/mh-magazine/includes/mh-custom-functions.php on line 394
Warning: Attempt to read property "post_title" on null in /www/wwwroot/coinpulsehq.com/wp-content/themes/mh-magazine/includes/mh-custom-functions.php on line 394
Onchain Highlights
DEFINITION: Realized volatility is the standard deviation of returns from the mean return of a market. High values in realized volatility indicate a phase of high risk in that market. It is measured on log returns over a fixed time horizon or over a rolling window to obtain a time-dependent observable. While implied volatility refers to the market’s assessment of future volatility, realized volatility measures what happened in the past. Here, we calculate the realized volatility based on daily returns and multiply it with a factor of sqrt(365) to yield the annualized daily realized volatility over a rolling window of 1 week.
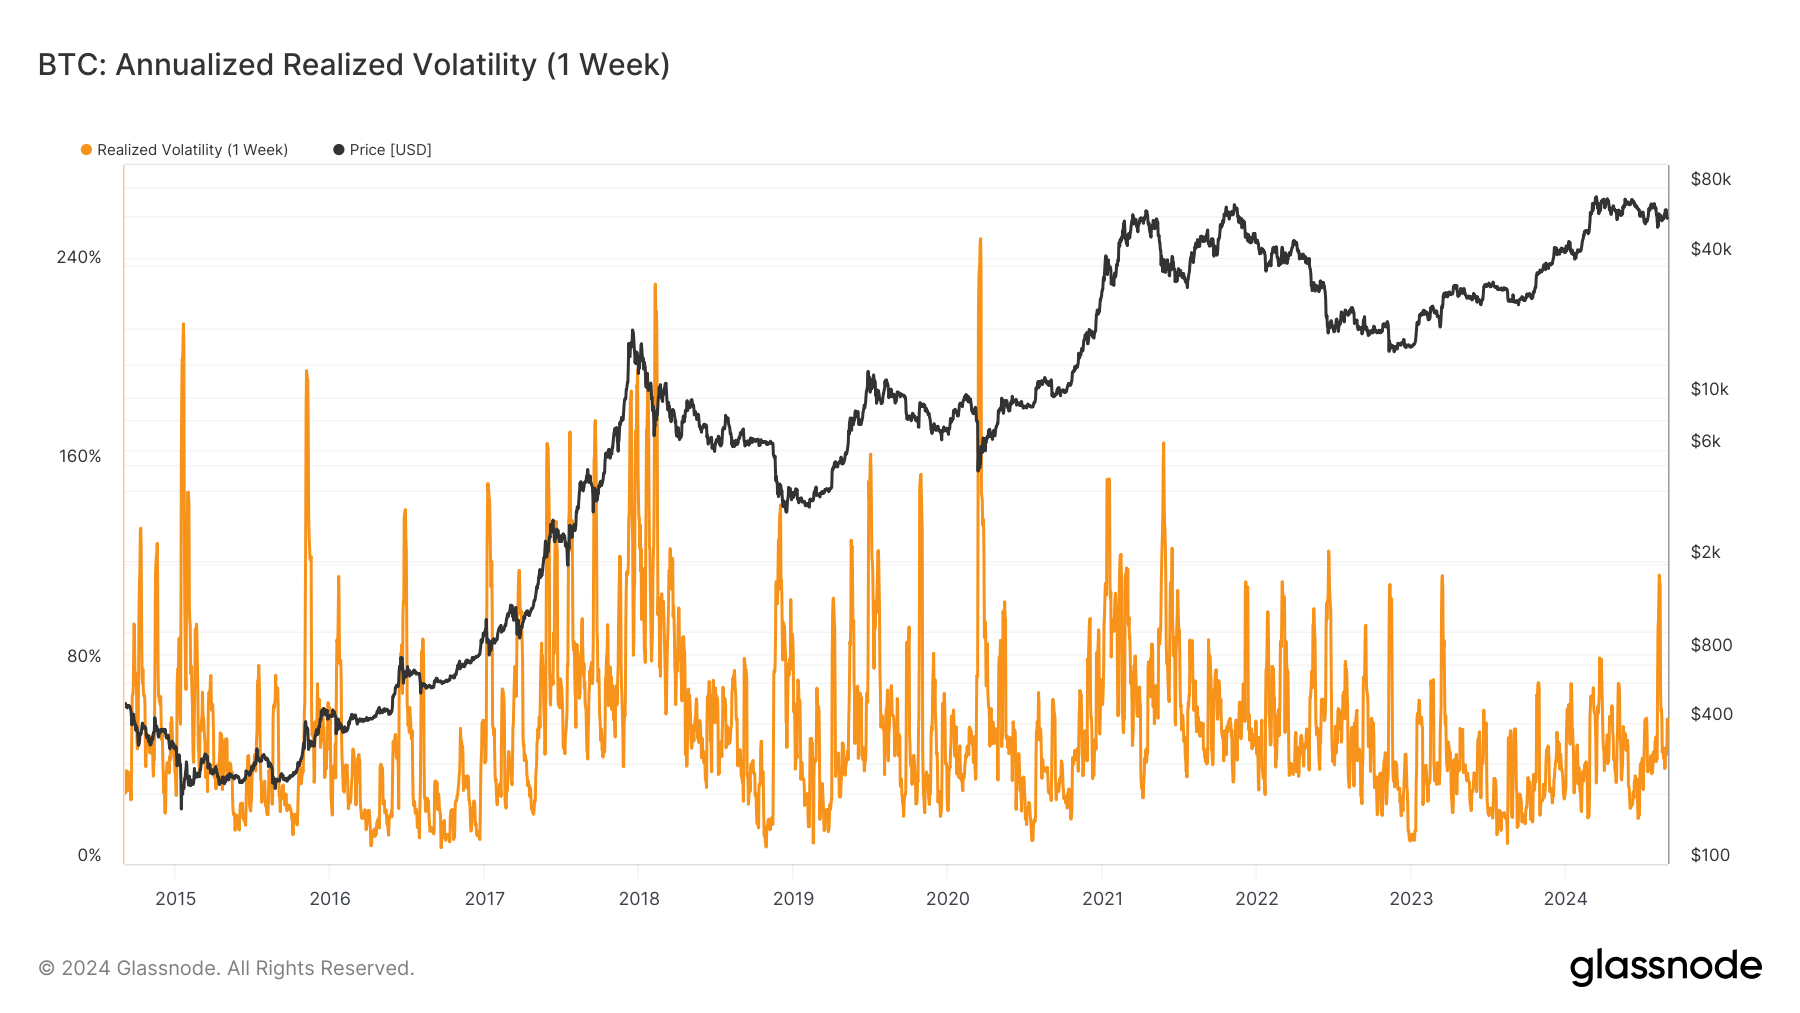
Bitcoin has experienced varying levels of realized volatility in recent years. The chart shows that Bitcoin’s annualized realized volatility over a 1-week window has seen significant fluctuations since 2023.
In September 2023, the volatility was relatively low but began to rise sharply, peaking a month later in November 2023. This period of increased volatility coincided with a substantial increase in Bitcoin’s price, which moved from approximately $20,000 to $60,000 within the same timeframe. However, this volatility subsided in early 2024 as Bitcoin’s price stabilized.
Comparing this to historical data since 2015, it’s evident that Bitcoin’s realized volatility has been a consistent feature of the asset, often spiking during periods of rapid price movement. These fluctuations reflect the market’s reaction to various macroeconomic factors and internal trends within the crypto space. As Bitcoin continues to mature as an asset class, these patterns in volatility may offer insights into market sentiment and the potential for future price movements.

The post Bitcoin’s realized volatility in August reaches highest level in over a year appeared first on CryptoSlate.
