Whitewhale’s Falling Wedge Breakout Signals Potential 215% Surge: Technical Analysis Points to $0.45000 Target
Global, May 2025: The cryptocurrency market continues to navigate volatile conditions, with various assets demonstrating divergent performance patterns. Among these, Whitewhale has attracted analytical attention following recent price movements that technical analysts interpret as potentially significant. A specific chart pattern known as a falling wedge has reportedly broken to the upside, leading some market observers to project specific price targets based on historical pattern behavior.
Understanding Whitewhale’s Recent Market Performance
Whitewhale operates within the broader cryptocurrency ecosystem, which has experienced considerable fluctuation throughout 2024 and into 2025. Market data from multiple exchanges shows that while many digital assets faced downward pressure during recent corrective phases, some individual tokens exhibited relative strength or distinctive chart formations. Technical analysts monitor these formations for potential signals about future price direction. The concept of a falling wedge pattern represents one such technical indicator that traders and analysts use to assess potential breakout scenarios and calculate risk-reward ratios.
Market participants typically define a falling wedge as a bullish chart pattern that forms within a downtrend, characterized by converging trend lines that slope downward. The pattern suggests that selling pressure is gradually diminishing, often preceding a reversal to the upside. A valid breakout is generally confirmed when the price closes decisively above the upper trendline of the wedge on increased trading volume. This technical event forms the basis for the current analytical discussion surrounding Whitewhale’s price chart.
Technical Analysis of the Falling Wedge Pattern
Technical analysis provides a framework for examining market psychology through price action and chart patterns. The falling wedge pattern has a documented history within financial markets, including traditional equities and cryptocurrencies. Analysts who follow this methodology measure the pattern’s height at its widest point to project a minimum price target following a confirmed breakout. This target represents the distance from the breakout point that the price could theoretically travel, based on the pattern’s size.
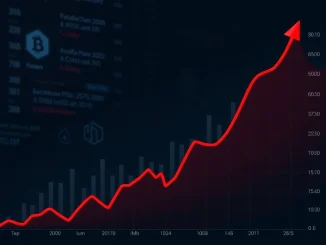
In the case discussed by some analysts, measurements taken from Whitewhale’s chart suggest a calculated technical target approximately 215% above recent breakout levels, which would place the token near the $0.45000 price point. It is crucial to understand that such projections are probabilistic, not deterministic. They represent one possible outcome based on historical pattern performance, not a guaranteed future result. Market conditions, trading volume, broader sentiment, and project-specific developments all influence whether a technical target is ultimately reached.
- Pattern Identification: A falling wedge is identified by two converging downward-sloping trendlines.
- Breakout Confirmation: Requires a decisive close above resistance with supporting volume.
- Target Calculation: Measured by adding the pattern’s height to the breakout point.
- Risk Management: Technical targets should always be considered alongside stop-loss levels.
Context Within Current Cryptocurrency Market Trends
The broader digital asset market provides essential context for analyzing any single token’s movement. Throughout 2024 and into 2025, the sector has experienced periods of consolidation following previous bull market cycles. Regulatory developments, institutional adoption rates, macroeconomic factors like interest rates, and technological advancements in blockchain infrastructure all contribute to the overall market environment. Within this context, individual assets can demonstrate independent price action based on their unique fundamentals, community activity, development milestones, and trading dynamics.
Analysts note that during market-wide corrections or periods of uncertainty, certain assets may develop technically significant patterns that attract attention from traders specializing in chart-based strategies. These patterns do not exist in isolation; they reflect the ongoing battle between buyers and sellers in the marketplace. The reported 100% profit for some traders referenced in initial reports would represent a specific trading outcome based on entry and exit timing, which varies significantly between individual market participants.
The Role of Technical Analysis in Cryptocurrency Trading
Technical analysis represents one school of thought for approaching financial markets, contrasting with fundamental analysis which focuses on intrinsic value based on project utility, team, tokenomics, and adoption metrics. Many cryptocurrency traders employ a hybrid approach, considering both technical patterns and fundamental developments. The effectiveness of technical patterns like the falling wedge is subject to ongoing debate within financial circles, with proponents citing historical precedents and critics pointing to the efficient market hypothesis.
For market participants, understanding the limitations of technical analysis is as important as understanding its potential applications. Pattern breakouts can fail, known as “false breakouts,” where price briefly moves beyond a trendline before reversing direction. Volume confirmation helps validate breakouts but does not eliminate risk entirely. Furthermore, in the highly volatile cryptocurrency markets, price movements can be exaggerated, and patterns may form and resolve more quickly than in traditional asset classes.
| Pattern Name | General Implication | Common Use Case |
|---|---|---|
| Falling Wedge | Bullish Reversal | End of Downtrend |
| Rising Wedge | Bearish Reversal | End of Uptrend |
| Head and Shoulders | Bearish Reversal | Trend Exhaustion |
| Inverse Head and Shoulders | Bullish Reversal | Trend Reversal |
| Flags and Pennants | Continuation | Brief Pause in Trend |
Analytical Perspectives on Price Targets
Financial analysts who publish price targets typically base their projections on specific methodologies, whether technical, fundamental, or quantitative. When an analyst references a target like $0.45000 for Whitewhale, they are applying a defined set of rules to the available chart data. Different analysts might use slightly different measurements or confirmation criteria, potentially arriving at varied targets. The transparency of their methodology allows other market participants to evaluate the reasoning behind the projection.
It is standard practice in financial journalism to present analyst projections as one possible scenario among many, noting that cryptocurrency markets are inherently unpredictable and subject to rapid change. Past performance of technical patterns does not guarantee future results, and all trading and investment decisions carry risk. Market participants should conduct their own research, consider their risk tolerance, and potentially consult with financial advisors before making decisions based on technical analysis or price targets.
Conclusion
Technical analysis of Whitewhale’s price chart has identified a falling wedge pattern that has reportedly broken out to the upside. Based on standard technical measurement techniques, this breakout suggests a potential price target near $0.45000, representing an approximate 215% movement from recent levels. This analysis exists within the broader context of a dynamic and volatile cryptocurrency market where multiple factors influence price discovery. While chart patterns provide one framework for understanding market dynamics, they represent probabilities rather than certainties. Market participants should approach such technical projections as informational tools within a comprehensive risk management strategy, acknowledging both the potential and the limitations of pattern-based analysis in digital asset markets.
FAQs
Q1: What is a falling wedge pattern in technical analysis?
A falling wedge is a bullish chart pattern characterized by two converging downward-sloping trendlines. It typically forms during a downtrend and suggests diminishing selling pressure, often preceding a potential reversal to the upside when the price breaks above the upper trendline.
Q2: How is the price target of $0.45000 calculated from the falling wedge?
The target is calculated using a standard technical analysis method: measuring the vertical height of the wedge pattern at its widest point and adding that distance to the price level at which the breakout occurred. This provides a minimum projected move based on the pattern’s size.
Q3: Does a falling wedge breakout guarantee the price will reach its target?
No, technical patterns do not guarantee outcomes. They suggest probabilistic scenarios based on historical performance. Breakouts can fail, and price targets are projections, not certainties. Market conditions, volume, and external factors all influence whether a target is achieved.
Q4: What is the difference between technical analysis and fundamental analysis for cryptocurrencies?
Technical analysis focuses on price charts, patterns, and trading indicators to predict future movements. Fundamental analysis evaluates intrinsic value based on factors like project utility, development team, tokenomics, adoption rates, and competitive positioning. Many traders use elements of both approaches.
Q5: How should traders approach analyst price targets like the one for Whitewhale?
Traders should treat analyst targets as one data point among many in their research process. It’s essential to understand the methodology behind the target, consider risk management strategies like stop-loss orders, and be aware that all market participation involves risk, especially in volatile asset classes like cryptocurrency.
Related News
- OPEN Perpetual Futures: Binance Unleashes Massive 75x Leverage Trading
- Coinbase Unleashes PUMP/USD Trading: An Exciting New Era Begins
- Grayscale Unveils 25+ Exciting Potential Crypto Investment Products
Related: Pivotal Move: Tether Expands Institutional Strategy With USD₮-Powered t-0 Network Investment
Related: Cardano ADA Price Revisits Critical Zone That Sparked Historic 2100% Rally